| Full name: midnolin | Alias Symbol: | ||
| Type: protein-coding gene | Cytoband: 19p13.3 | ||
| Entrez ID: 90007 | HGNC ID: HGNC:16298 | Ensembl Gene: ENSG00000167470 | OMIM ID: 606700 |
Expression of MIDN:
| Dataset | Gene | EntrezID | Probe | Log2FC | Adj.pValue | Expression |
|---|---|---|---|---|---|---|
| GSE17351 | MIDN | 90007 | 225954_s_at | -0.1734 | 0.8648 | |
| GSE26886 | MIDN | 90007 | 225954_s_at | -1.3090 | 0.0006 | |
| GSE45670 | MIDN | 90007 | 225954_s_at | -0.0232 | 0.9257 | |
| GSE53622 | MIDN | 90007 | 11242 | -0.8480 | 0.0000 | |
| GSE53624 | MIDN | 90007 | 11242 | -0.7051 | 0.0000 | |
| GSE63941 | MIDN | 90007 | 225954_s_at | -0.6877 | 0.0920 | |
| GSE77861 | MIDN | 90007 | 225954_s_at | 0.2127 | 0.6800 | |
| GSE97050 | MIDN | 90007 | A_33_P3338335 | -0.8258 | 0.0684 | |
| SRP007169 | MIDN | 90007 | RNAseq | -1.1339 | 0.0005 | |
| SRP008496 | MIDN | 90007 | RNAseq | -1.3587 | 0.0000 | |
| SRP064894 | MIDN | 90007 | RNAseq | -1.2179 | 0.0000 | |
| SRP133303 | MIDN | 90007 | RNAseq | -0.3039 | 0.2405 | |
| SRP159526 | MIDN | 90007 | RNAseq | -0.6776 | 0.0554 | |
| SRP193095 | MIDN | 90007 | RNAseq | -0.1808 | 0.3263 | |
| SRP219564 | MIDN | 90007 | RNAseq | -0.8523 | 0.0182 | |
| TCGA | MIDN | 90007 | RNAseq | -0.0413 | 0.3914 |
Upregulated datasets: 0; Downregulated datasets: 4.
Survival by MIDN expression:
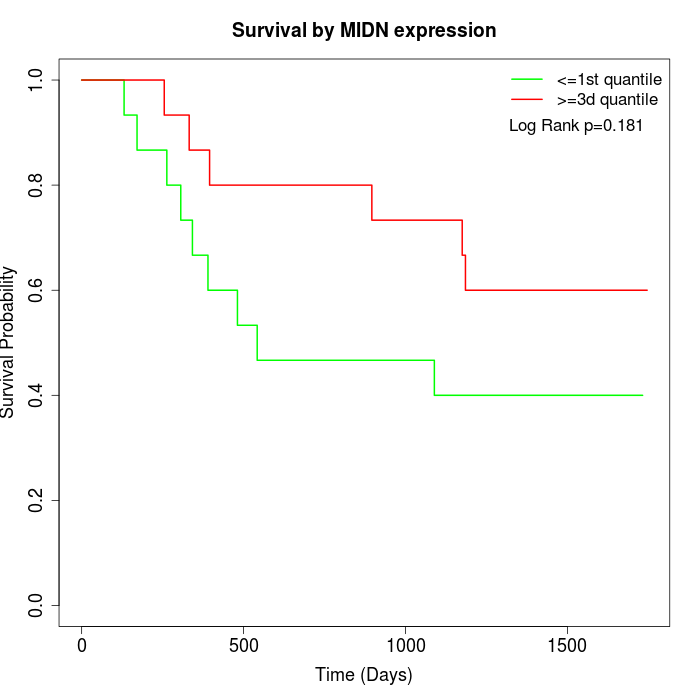 | 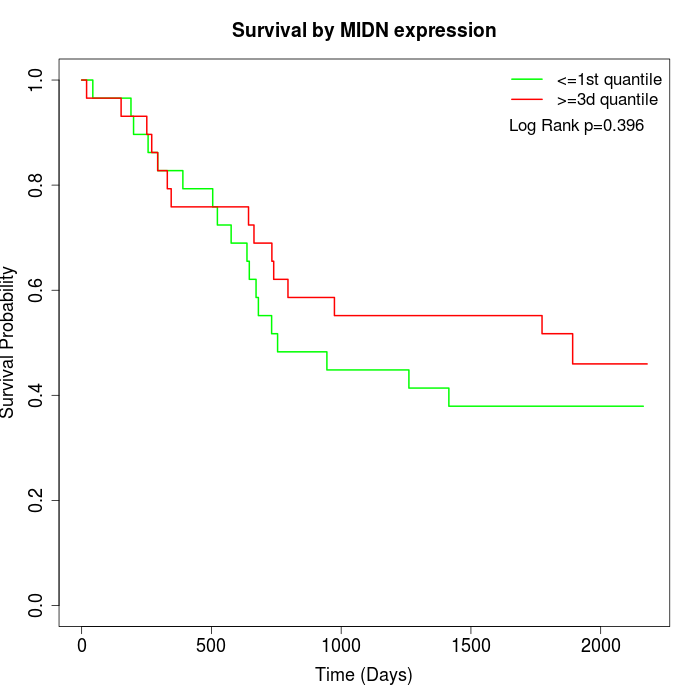 | 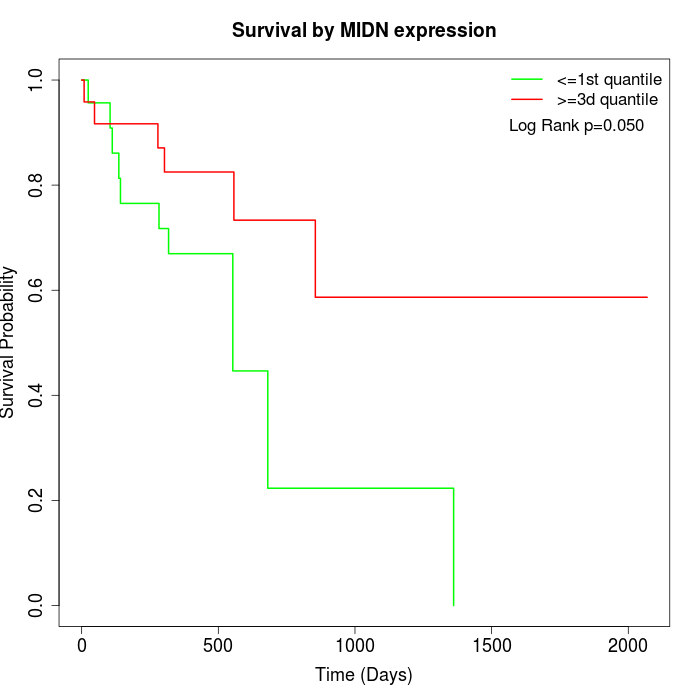 |
| GSE53622 | GSE53624 | TCGA |
Note: Click image to view full size file.
Copy number change of MIDN:
| Dataset | Gene | EntrezID | Gain | Loss | Normal | Detail |
|---|---|---|---|---|---|---|
| GSE15526 | MIDN | 90007 | 4 | 6 | 20 | |
| GSE20123 | MIDN | 90007 | 4 | 5 | 21 | |
| GSE43470 | MIDN | 90007 | 1 | 11 | 31 | |
| GSE46452 | MIDN | 90007 | 47 | 1 | 11 | |
| GSE47630 | MIDN | 90007 | 5 | 7 | 28 | |
| GSE54993 | MIDN | 90007 | 13 | 4 | 53 | |
| GSE54994 | MIDN | 90007 | 8 | 15 | 30 | |
| GSE60625 | MIDN | 90007 | 9 | 0 | 2 | |
| GSE74703 | MIDN | 90007 | 1 | 8 | 27 | |
| GSE74704 | MIDN | 90007 | 3 | 3 | 14 | |
| TCGA | MIDN | 90007 | 7 | 25 | 64 |
Total number of gains: 102; Total number of losses: 85; Total Number of normals: 301.
Somatic mutations of MIDN:
Generating mutation plots.
Highly correlated genes for MIDN:
Showing top 20/387 corelated genes with mean PCC>0.5.
| Gene1 | Gene2 | Mean PCC | Num. Datasets | Num. PCC<0 | Num. PCC>0.5 |
|---|---|---|---|---|---|
| MIDN | PIM1 | 0.705512 | 5 | 0 | 4 |
| MIDN | EGR1 | 0.679539 | 3 | 0 | 3 |
| MIDN | LMNA | 0.679069 | 3 | 0 | 3 |
| MIDN | ZNF585B | 0.677437 | 3 | 0 | 3 |
| MIDN | TNRC6A | 0.674447 | 3 | 0 | 3 |
| MIDN | CHMP1B | 0.671455 | 3 | 0 | 3 |
| MIDN | RASSF3 | 0.667819 | 3 | 0 | 3 |
| MIDN | DUSP1 | 0.667609 | 6 | 0 | 5 |
| MIDN | STIM1 | 0.665951 | 4 | 0 | 3 |
| MIDN | PLK3 | 0.65516 | 5 | 0 | 5 |
| MIDN | HIGD1A | 0.654102 | 5 | 0 | 4 |
| MIDN | PDCD4 | 0.654033 | 3 | 0 | 3 |
| MIDN | CRYAB | 0.652978 | 5 | 0 | 5 |
| MIDN | LACTBL1 | 0.649693 | 3 | 0 | 3 |
| MIDN | TSC22D2 | 0.648551 | 5 | 0 | 5 |
| MIDN | XK | 0.647098 | 3 | 0 | 3 |
| MIDN | SLC25A25 | 0.645427 | 5 | 0 | 5 |
| MIDN | ITPRIP | 0.645247 | 6 | 0 | 6 |
| MIDN | ITPKC | 0.644557 | 7 | 0 | 6 |
| MIDN | KANK1 | 0.643269 | 4 | 0 | 4 |
For details and further investigation, click here