| Full name: inositol 1,4,5-trisphosphate receptor interacting protein | Alias Symbol: bA127L20.2|DANGER | ||
| Type: protein-coding gene | Cytoband: 10q25.1 | ||
| Entrez ID: 85450 | HGNC ID: HGNC:29370 | Ensembl Gene: ENSG00000148841 | OMIM ID: |
Expression of ITPRIP:
| Dataset | Gene | EntrezID | Probe | Log2FC | Adj.pValue | Expression |
|---|---|---|---|---|---|---|
| GSE17351 | ITPRIP | 85450 | 225582_at | -0.8925 | 0.1943 | |
| GSE26886 | ITPRIP | 85450 | 225582_at | -0.6629 | 0.0547 | |
| GSE45670 | ITPRIP | 85450 | 225582_at | -0.1746 | 0.5112 | |
| GSE53622 | ITPRIP | 85450 | 69388 | -0.9058 | 0.0000 | |
| GSE53624 | ITPRIP | 85450 | 69388 | -0.7185 | 0.0000 | |
| GSE63941 | ITPRIP | 85450 | 225582_at | -0.4546 | 0.4982 | |
| GSE77861 | ITPRIP | 85450 | 225582_at | -0.6129 | 0.0172 | |
| GSE97050 | ITPRIP | 85450 | A_23_P340333 | 0.0514 | 0.8589 | |
| SRP007169 | ITPRIP | 85450 | RNAseq | -2.1457 | 0.0000 | |
| SRP008496 | ITPRIP | 85450 | RNAseq | -1.6382 | 0.0000 | |
| SRP064894 | ITPRIP | 85450 | RNAseq | -0.8763 | 0.0003 | |
| SRP133303 | ITPRIP | 85450 | RNAseq | -0.4382 | 0.0445 | |
| SRP159526 | ITPRIP | 85450 | RNAseq | -1.0374 | 0.0589 | |
| SRP193095 | ITPRIP | 85450 | RNAseq | -0.7418 | 0.0073 | |
| SRP219564 | ITPRIP | 85450 | RNAseq | -0.5271 | 0.1963 | |
| TCGA | ITPRIP | 85450 | RNAseq | -0.0198 | 0.7966 |
Upregulated datasets: 0; Downregulated datasets: 2.
Survival by ITPRIP expression:
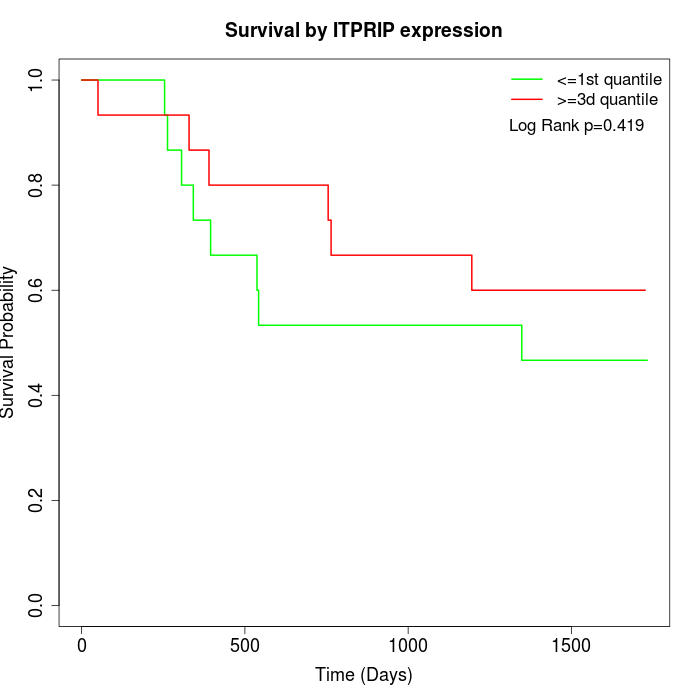 | 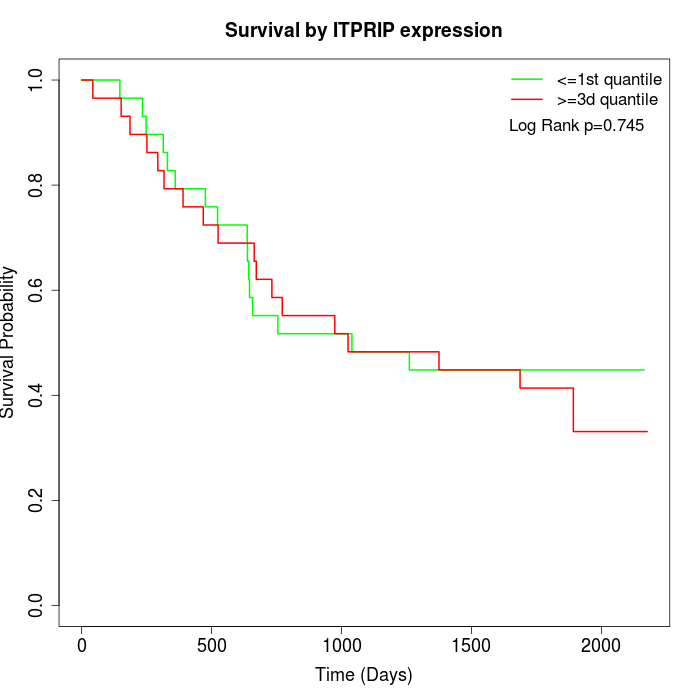 | 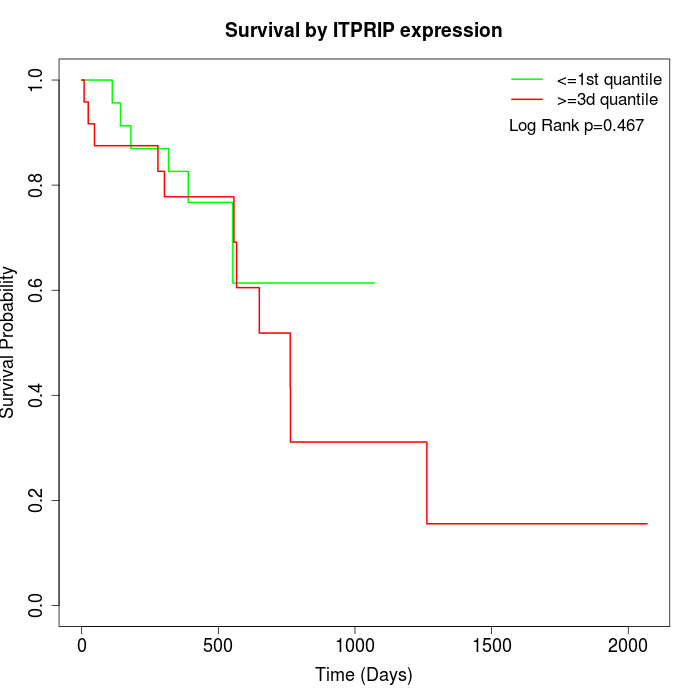 |
| GSE53622 | GSE53624 | TCGA |
Note: Click image to view full size file.
Copy number change of ITPRIP:
| Dataset | Gene | EntrezID | Gain | Loss | Normal | Detail |
|---|---|---|---|---|---|---|
| GSE15526 | ITPRIP | 85450 | 1 | 10 | 19 | |
| GSE20123 | ITPRIP | 85450 | 1 | 8 | 21 | |
| GSE43470 | ITPRIP | 85450 | 0 | 7 | 36 | |
| GSE46452 | ITPRIP | 85450 | 0 | 11 | 48 | |
| GSE47630 | ITPRIP | 85450 | 2 | 14 | 24 | |
| GSE54993 | ITPRIP | 85450 | 8 | 0 | 62 | |
| GSE54994 | ITPRIP | 85450 | 1 | 10 | 42 | |
| GSE60625 | ITPRIP | 85450 | 0 | 0 | 11 | |
| GSE74703 | ITPRIP | 85450 | 0 | 5 | 31 | |
| GSE74704 | ITPRIP | 85450 | 0 | 4 | 16 | |
| TCGA | ITPRIP | 85450 | 6 | 28 | 62 |
Total number of gains: 19; Total number of losses: 97; Total Number of normals: 372.
Somatic mutations of ITPRIP:
Generating mutation plots.
Highly correlated genes for ITPRIP:
Showing top 20/933 corelated genes with mean PCC>0.5.
| Gene1 | Gene2 | Mean PCC | Num. Datasets | Num. PCC<0 | Num. PCC>0.5 |
|---|---|---|---|---|---|
| ITPRIP | BHLHE40 | 0.769799 | 6 | 0 | 6 |
| ITPRIP | CRYZ | 0.756497 | 3 | 0 | 3 |
| ITPRIP | TMUB2 | 0.75236 | 3 | 0 | 3 |
| ITPRIP | SRR | 0.752176 | 3 | 0 | 3 |
| ITPRIP | CRX | 0.745735 | 4 | 0 | 4 |
| ITPRIP | KDM3B | 0.744846 | 3 | 0 | 3 |
| ITPRIP | GRHPR | 0.742616 | 3 | 0 | 3 |
| ITPRIP | TIRAP | 0.734325 | 3 | 0 | 3 |
| ITPRIP | TMEM19 | 0.732176 | 3 | 0 | 3 |
| ITPRIP | TUBB2A | 0.731571 | 6 | 0 | 6 |
| ITPRIP | MAPK11 | 0.722595 | 3 | 0 | 3 |
| ITPRIP | SEC16B | 0.721632 | 3 | 0 | 3 |
| ITPRIP | AMOTL2 | 0.717328 | 6 | 0 | 5 |
| ITPRIP | RNF148 | 0.71139 | 3 | 0 | 3 |
| ITPRIP | TOB1 | 0.709345 | 6 | 0 | 6 |
| ITPRIP | TRIM5 | 0.706482 | 3 | 0 | 3 |
| ITPRIP | C11orf54 | 0.702954 | 3 | 0 | 3 |
| ITPRIP | PTPN23 | 0.701162 | 3 | 0 | 3 |
| ITPRIP | RABGGTA | 0.70108 | 6 | 0 | 6 |
| ITPRIP | RNF10 | 0.697793 | 7 | 0 | 7 |
For details and further investigation, click here