| Full name: Pim-1 proto-oncogene, serine/threonine kinase | Alias Symbol: | ||
| Type: protein-coding gene | Cytoband: 6p21.2 | ||
| Entrez ID: 5292 | HGNC ID: HGNC:8986 | Ensembl Gene: ENSG00000137193 | OMIM ID: 164960 |
| Related drugs: AZD-1208, CHEMBL2030402, ISONICOTINIC ACID, LGH-447, RUBOXISTAURIN, SGI-1776, SILMITASERTIB, SIROLIMUS... [more] | |||
Screen Evidence:
| |||
PIM1 involved pathways:
| KEGG pathway | Description | View |
|---|---|---|
| hsa04630 | Jak-STAT signaling pathway | |
| hsa04933 | AGE-RAGE signaling pathway in diabetic complications | |
| hsa05221 | Acute myeloid leukemia |
Expression of PIM1:
| Dataset | Gene | EntrezID | Probe | Log2FC | Adj.pValue | Expression |
|---|---|---|---|---|---|---|
| GSE17351 | PIM1 | 5292 | 209193_at | -1.2715 | 0.0362 | |
| GSE20347 | PIM1 | 5292 | 209193_at | -1.3713 | 0.0000 | |
| GSE23400 | PIM1 | 5292 | 209193_at | -1.3042 | 0.0000 | |
| GSE26886 | PIM1 | 5292 | 209193_at | -2.5048 | 0.0000 | |
| GSE29001 | PIM1 | 5292 | 209193_at | -1.7886 | 0.0001 | |
| GSE38129 | PIM1 | 5292 | 209193_at | -1.0367 | 0.0000 | |
| GSE45670 | PIM1 | 5292 | 209193_at | -0.6297 | 0.0304 | |
| GSE53622 | PIM1 | 5292 | 34076 | -1.6153 | 0.0000 | |
| GSE53624 | PIM1 | 5292 | 34076 | -1.5377 | 0.0000 | |
| GSE63941 | PIM1 | 5292 | 209193_at | -0.2855 | 0.6484 | |
| GSE77861 | PIM1 | 5292 | 209193_at | -1.1500 | 0.0003 | |
| GSE97050 | PIM1 | 5292 | A_23_P345118 | -0.7832 | 0.1242 | |
| SRP007169 | PIM1 | 5292 | RNAseq | -4.2120 | 0.0000 | |
| SRP008496 | PIM1 | 5292 | RNAseq | -3.8851 | 0.0000 | |
| SRP064894 | PIM1 | 5292 | RNAseq | -1.9226 | 0.0000 | |
| SRP133303 | PIM1 | 5292 | RNAseq | -1.7714 | 0.0000 | |
| SRP159526 | PIM1 | 5292 | RNAseq | -2.7047 | 0.0000 | |
| SRP193095 | PIM1 | 5292 | RNAseq | -1.8377 | 0.0000 | |
| SRP219564 | PIM1 | 5292 | RNAseq | -1.9088 | 0.0001 | |
| TCGA | PIM1 | 5292 | RNAseq | 0.0047 | 0.9571 |
Upregulated datasets: 0; Downregulated datasets: 16.
Survival by PIM1 expression:
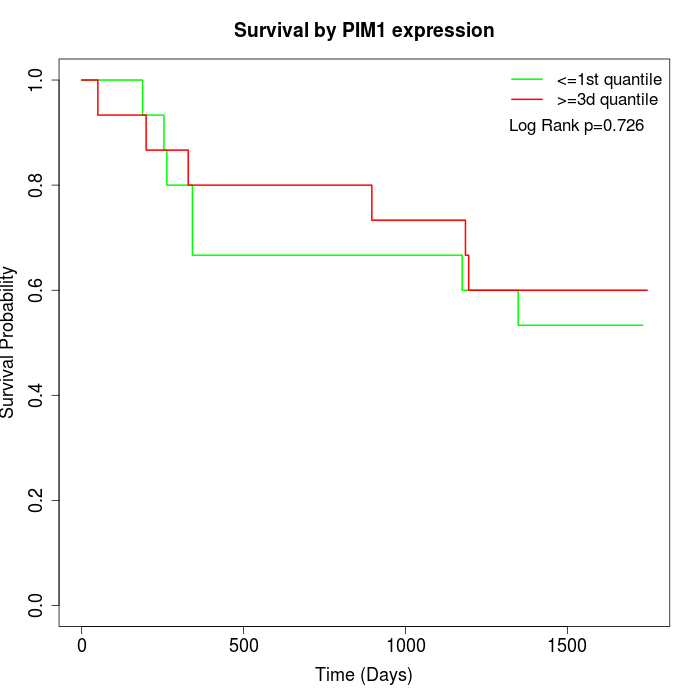 | 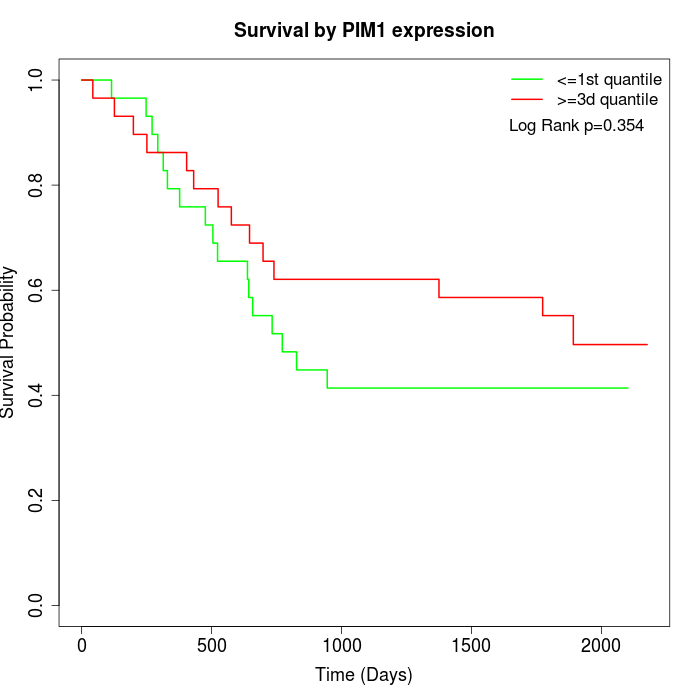 | 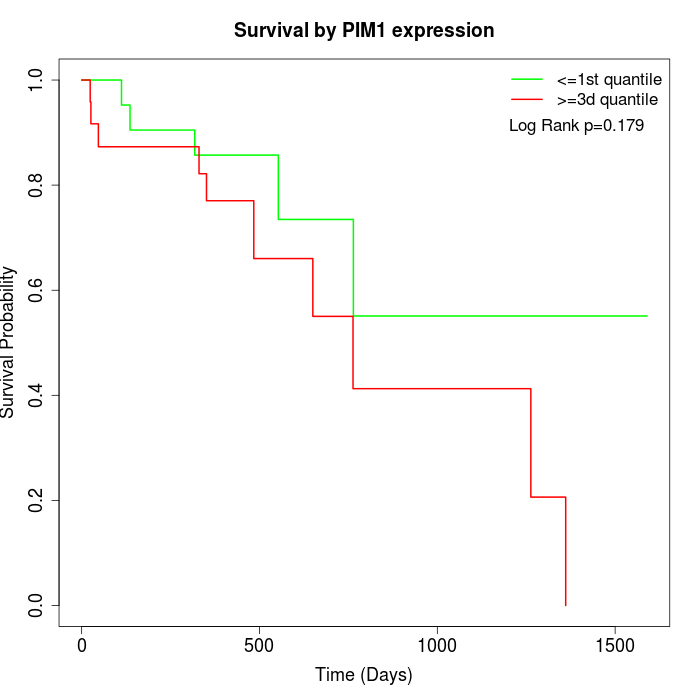 |
| GSE53622 | GSE53624 | TCGA |
Note: Click image to view full size file.
Copy number change of PIM1:
| Dataset | Gene | EntrezID | Gain | Loss | Normal | Detail |
|---|---|---|---|---|---|---|
| GSE15526 | PIM1 | 5292 | 6 | 0 | 24 | |
| GSE20123 | PIM1 | 5292 | 6 | 0 | 24 | |
| GSE43470 | PIM1 | 5292 | 5 | 1 | 37 | |
| GSE46452 | PIM1 | 5292 | 2 | 9 | 48 | |
| GSE47630 | PIM1 | 5292 | 8 | 4 | 28 | |
| GSE54993 | PIM1 | 5292 | 3 | 1 | 66 | |
| GSE54994 | PIM1 | 5292 | 10 | 5 | 38 | |
| GSE60625 | PIM1 | 5292 | 1 | 0 | 10 | |
| GSE74703 | PIM1 | 5292 | 5 | 0 | 31 | |
| GSE74704 | PIM1 | 5292 | 3 | 0 | 17 | |
| TCGA | PIM1 | 5292 | 16 | 14 | 66 |
Total number of gains: 65; Total number of losses: 34; Total Number of normals: 389.
Somatic mutations of PIM1:
Generating mutation plots.
Highly correlated genes for PIM1:
Showing top 20/1791 corelated genes with mean PCC>0.5.
| Gene1 | Gene2 | Mean PCC | Num. Datasets | Num. PCC<0 | Num. PCC>0.5 |
|---|---|---|---|---|---|
| PIM1 | TRIP10 | 0.859084 | 11 | 0 | 11 |
| PIM1 | GDPD3 | 0.85321 | 10 | 0 | 10 |
| PIM1 | CYSRT1 | 0.850766 | 6 | 0 | 6 |
| PIM1 | ECM1 | 0.848653 | 10 | 0 | 10 |
| PIM1 | EVPL | 0.847958 | 10 | 0 | 10 |
| PIM1 | SCNN1B | 0.841147 | 10 | 0 | 10 |
| PIM1 | VSIG10L | 0.838043 | 6 | 0 | 6 |
| PIM1 | FCHO2 | 0.836328 | 7 | 0 | 7 |
| PIM1 | IL1RN | 0.832377 | 10 | 0 | 10 |
| PIM1 | PRSS27 | 0.830871 | 6 | 0 | 6 |
| PIM1 | PADI1 | 0.82991 | 8 | 0 | 8 |
| PIM1 | SNORA68 | 0.82868 | 4 | 0 | 4 |
| PIM1 | ALS2CL | 0.826636 | 10 | 0 | 10 |
| PIM1 | CRCT1 | 0.825463 | 11 | 0 | 10 |
| PIM1 | DUSP5 | 0.825042 | 11 | 0 | 11 |
| PIM1 | MALL | 0.823689 | 11 | 0 | 10 |
| PIM1 | GYS2 | 0.81738 | 10 | 0 | 10 |
| PIM1 | NLRX1 | 0.813456 | 10 | 0 | 10 |
| PIM1 | SH3GL1 | 0.811861 | 11 | 0 | 11 |
| PIM1 | TOM1 | 0.81048 | 11 | 0 | 11 |
For details and further investigation, click here