| Full name: motor neuron and pancreas homeobox 1 | Alias Symbol: HB9|HOXHB9|SCRA1 | ||
| Type: protein-coding gene | Cytoband: 7q36.3 | ||
| Entrez ID: 3110 | HGNC ID: HGNC:4979 | Ensembl Gene: ENSG00000130675 | OMIM ID: 142994 |
MNX1 involved pathways:
| KEGG pathway | Description | View |
|---|---|---|
| hsa04950 | Maturity onset diabetes of the young |
Expression of MNX1:
| Dataset | Gene | EntrezID | Probe | Log2FC | Adj.pValue | Expression |
|---|---|---|---|---|---|---|
| GSE17351 | MNX1 | 3110 | 214614_at | 0.1446 | 0.6837 | |
| GSE20347 | MNX1 | 3110 | 214614_at | 0.2368 | 0.0534 | |
| GSE23400 | MNX1 | 3110 | 214614_at | -0.0493 | 0.1884 | |
| GSE26886 | MNX1 | 3110 | 214614_at | 0.3346 | 0.0452 | |
| GSE29001 | MNX1 | 3110 | 214614_at | 0.1251 | 0.6459 | |
| GSE38129 | MNX1 | 3110 | 214614_at | 0.2210 | 0.0788 | |
| GSE45670 | MNX1 | 3110 | 214614_at | 0.0856 | 0.6499 | |
| GSE53622 | MNX1 | 3110 | 21051 | 0.0550 | 0.4581 | |
| GSE53624 | MNX1 | 3110 | 21051 | -0.0908 | 0.4437 | |
| GSE63941 | MNX1 | 3110 | 214614_at | 1.2979 | 0.0008 | |
| GSE77861 | MNX1 | 3110 | 214614_at | 0.0926 | 0.5127 | |
| TCGA | MNX1 | 3110 | RNAseq | -0.7527 | 0.1533 |
Upregulated datasets: 1; Downregulated datasets: 0.
Survival by MNX1 expression:
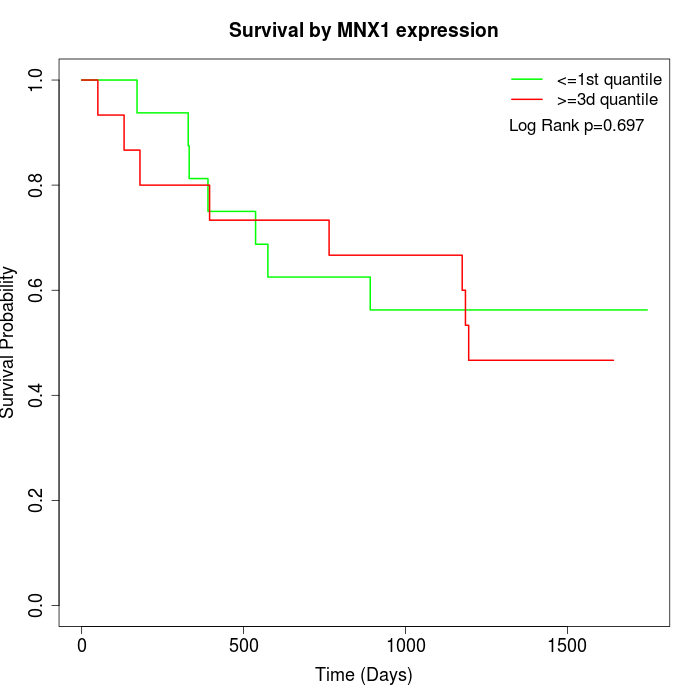 | 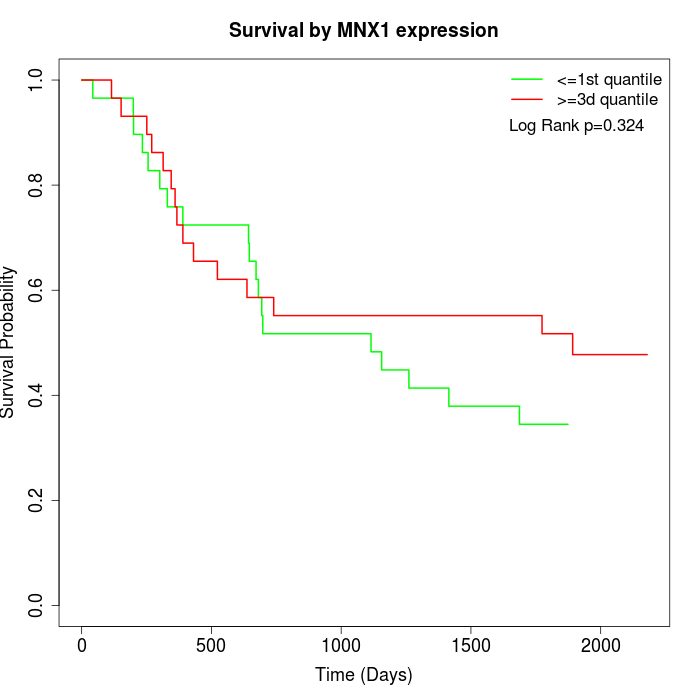 | 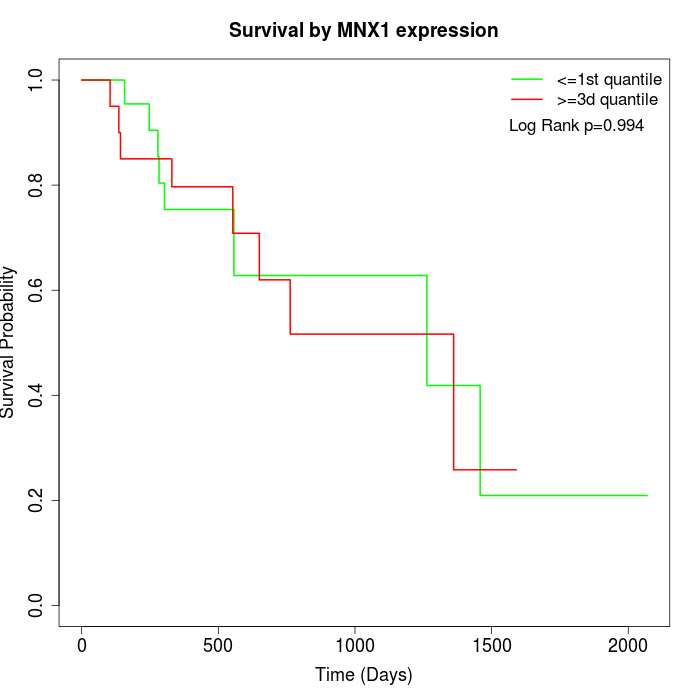 |
| GSE53622 | GSE53624 | TCGA |
Note: Click image to view full size file.
Copy number change of MNX1:
| Dataset | Gene | EntrezID | Gain | Loss | Normal | Detail |
|---|---|---|---|---|---|---|
| GSE15526 | MNX1 | 3110 | 4 | 3 | 23 | |
| GSE20123 | MNX1 | 3110 | 3 | 3 | 24 | |
| GSE43470 | MNX1 | 3110 | 2 | 5 | 36 | |
| GSE46452 | MNX1 | 3110 | 7 | 2 | 50 | |
| GSE47630 | MNX1 | 3110 | 6 | 9 | 25 | |
| GSE54993 | MNX1 | 3110 | 3 | 3 | 64 | |
| GSE54994 | MNX1 | 3110 | 6 | 8 | 39 | |
| GSE60625 | MNX1 | 3110 | 0 | 0 | 11 | |
| GSE74703 | MNX1 | 3110 | 2 | 4 | 30 | |
| GSE74704 | MNX1 | 3110 | 1 | 3 | 16 | |
| TCGA | MNX1 | 3110 | 27 | 25 | 44 |
Total number of gains: 61; Total number of losses: 65; Total Number of normals: 362.
Somatic mutations of MNX1:
Generating mutation plots.
Highly correlated genes for MNX1:
Showing top 20/242 corelated genes with mean PCC>0.5.
| Gene1 | Gene2 | Mean PCC | Num. Datasets | Num. PCC<0 | Num. PCC>0.5 |
|---|---|---|---|---|---|
| MNX1 | FOXE3 | 0.755694 | 3 | 0 | 3 |
| MNX1 | CNOT3 | 0.714622 | 4 | 0 | 4 |
| MNX1 | KCTD19 | 0.695198 | 3 | 0 | 3 |
| MNX1 | CDH24 | 0.69476 | 3 | 0 | 3 |
| MNX1 | POM121L12 | 0.682556 | 3 | 0 | 3 |
| MNX1 | SYCN | 0.682119 | 3 | 0 | 3 |
| MNX1 | DSCR10 | 0.664486 | 3 | 0 | 3 |
| MNX1 | CARD11 | 0.657196 | 3 | 0 | 3 |
| MNX1 | FAM205A | 0.655704 | 3 | 0 | 3 |
| MNX1 | FAM161A | 0.650361 | 3 | 0 | 3 |
| MNX1 | NBR2 | 0.647231 | 3 | 0 | 3 |
| MNX1 | C19orf44 | 0.642378 | 3 | 0 | 3 |
| MNX1 | RFPL3S | 0.637217 | 5 | 0 | 4 |
| MNX1 | SLC6A3 | 0.630232 | 4 | 0 | 4 |
| MNX1 | SELPLG | 0.6299 | 4 | 0 | 4 |
| MNX1 | FLT4 | 0.629154 | 4 | 0 | 3 |
| MNX1 | LRRC27 | 0.628158 | 3 | 0 | 3 |
| MNX1 | CTPS2 | 0.623145 | 3 | 0 | 3 |
| MNX1 | TMEM151A | 0.617829 | 4 | 0 | 3 |
| MNX1 | GPR35 | 0.612437 | 3 | 0 | 3 |
For details and further investigation, click here