| Full name: neighbor of BRCA1 lncRNA 2 | Alias Symbol: NCRNA00192 | ||
| Type: non-coding RNA | Cytoband: 17q21.31 | ||
| Entrez ID: 10230 | HGNC ID: HGNC:20691 | Ensembl Gene: ENSG00000198496 | OMIM ID: |
Expression of NBR2:
| Dataset | Gene | EntrezID | Probe | Log2FC | Adj.pValue | Expression |
|---|---|---|---|---|---|---|
| GSE17351 | NBR2 | 10230 | 1553992_s_at | 0.0079 | 0.9830 | |
| GSE20347 | NBR2 | 10230 | 207631_at | 0.2326 | 0.0093 | |
| GSE23400 | NBR2 | 10230 | 207631_at | 0.0615 | 0.1359 | |
| GSE26886 | NBR2 | 10230 | 1553992_s_at | -0.3335 | 0.2602 | |
| GSE29001 | NBR2 | 10230 | 207631_at | 0.4920 | 0.0598 | |
| GSE38129 | NBR2 | 10230 | 207631_at | 0.2153 | 0.0132 | |
| GSE45670 | NBR2 | 10230 | 1553992_s_at | 0.3560 | 0.0882 | |
| GSE63941 | NBR2 | 10230 | 1553992_s_at | 1.1366 | 0.0728 | |
| GSE77861 | NBR2 | 10230 | 207631_at | 0.1050 | 0.4003 | |
| SRP007169 | NBR2 | 10230 | RNAseq | 0.5927 | 0.3751 | |
| SRP064894 | NBR2 | 10230 | RNAseq | 0.4913 | 0.0136 | |
| SRP133303 | NBR2 | 10230 | RNAseq | 0.0362 | 0.8009 | |
| SRP159526 | NBR2 | 10230 | RNAseq | 0.4336 | 0.1658 | |
| SRP193095 | NBR2 | 10230 | RNAseq | 0.2079 | 0.1108 | |
| SRP219564 | NBR2 | 10230 | RNAseq | 0.5400 | 0.1883 | |
| TCGA | NBR2 | 10230 | RNAseq | -0.0716 | 0.4495 |
Upregulated datasets: 0; Downregulated datasets: 0.
Survival by NBR2 expression:
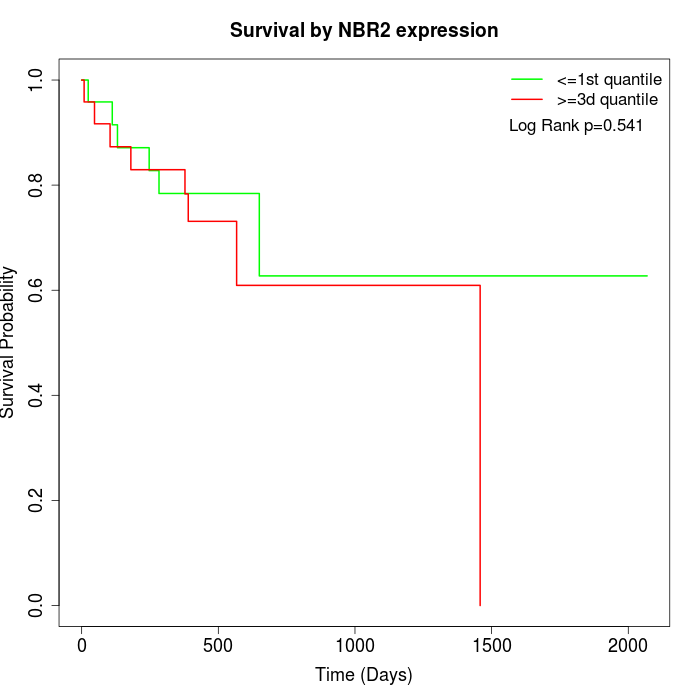 |
| TCGA |
Note: Click image to view full size file.
Copy number change of NBR2:
| Dataset | Gene | EntrezID | Gain | Loss | Normal | Detail |
|---|---|---|---|---|---|---|
| GSE15526 | NBR2 | 10230 | 6 | 2 | 22 | |
| GSE20123 | NBR2 | 10230 | 6 | 2 | 22 | |
| GSE43470 | NBR2 | 10230 | 1 | 2 | 40 | |
| GSE46452 | NBR2 | 10230 | 34 | 0 | 25 | |
| GSE47630 | NBR2 | 10230 | 8 | 1 | 31 | |
| GSE54993 | NBR2 | 10230 | 3 | 4 | 63 | |
| GSE54994 | NBR2 | 10230 | 8 | 5 | 40 | |
| GSE60625 | NBR2 | 10230 | 4 | 0 | 7 | |
| GSE74703 | NBR2 | 10230 | 1 | 1 | 34 | |
| GSE74704 | NBR2 | 10230 | 4 | 1 | 15 | |
| TCGA | NBR2 | 10230 | 22 | 7 | 67 |
Total number of gains: 97; Total number of losses: 25; Total Number of normals: 366.
Somatic mutations of NBR2:
Generating mutation plots.
Highly correlated genes for NBR2:
Showing top 20/44 corelated genes with mean PCC>0.5.
| Gene1 | Gene2 | Mean PCC | Num. Datasets | Num. PCC<0 | Num. PCC>0.5 |
|---|---|---|---|---|---|
| NBR2 | MNX1 | 0.647231 | 3 | 0 | 3 |
| NBR2 | WDR6 | 0.645173 | 3 | 0 | 3 |
| NBR2 | RAB11FIP3 | 0.634112 | 3 | 0 | 3 |
| NBR2 | PHC3 | 0.62764 | 4 | 0 | 4 |
| NBR2 | ARID5A | 0.61606 | 4 | 0 | 3 |
| NBR2 | COLEC11 | 0.614062 | 5 | 0 | 4 |
| NBR2 | CALML4 | 0.612669 | 4 | 0 | 3 |
| NBR2 | PRR11 | 0.600885 | 4 | 0 | 3 |
| NBR2 | HAUS5 | 0.599357 | 4 | 0 | 4 |
| NBR2 | NXF1 | 0.592279 | 3 | 0 | 3 |
| NBR2 | OGDHL | 0.589471 | 4 | 0 | 4 |
| NBR2 | FREM2 | 0.582961 | 3 | 0 | 3 |
| NBR2 | GSDMB | 0.56924 | 5 | 0 | 3 |
| NBR2 | AXIN1 | 0.565786 | 4 | 0 | 3 |
| NBR2 | NDE1 | 0.56147 | 4 | 0 | 3 |
| NBR2 | HOXB9 | 0.560878 | 3 | 0 | 3 |
| NBR2 | TTF1 | 0.557905 | 6 | 0 | 5 |
| NBR2 | DDX11 | 0.556798 | 5 | 0 | 4 |
| NBR2 | APBA2 | 0.55675 | 5 | 0 | 3 |
| NBR2 | AKT2 | 0.55576 | 4 | 0 | 3 |
For details and further investigation, click here