| Full name: msh homeobox 1 | Alias Symbol: HYD1|OFC5 | ||
| Type: protein-coding gene | Cytoband: 4p16.2 | ||
| Entrez ID: 4487 | HGNC ID: HGNC:7391 | Ensembl Gene: ENSG00000163132 | OMIM ID: 142983 |
Expression of MSX1:
| Dataset | Gene | EntrezID | Probe | Log2FC | Adj.pValue | Expression |
|---|---|---|---|---|---|---|
| GSE17351 | MSX1 | 4487 | 205932_s_at | 0.5510 | 0.4992 | |
| GSE20347 | MSX1 | 4487 | 205932_s_at | 0.2798 | 0.0730 | |
| GSE23400 | MSX1 | 4487 | 205932_s_at | -0.0607 | 0.1156 | |
| GSE26886 | MSX1 | 4487 | 205932_s_at | 1.1618 | 0.0062 | |
| GSE29001 | MSX1 | 4487 | 205932_s_at | 0.2614 | 0.2520 | |
| GSE38129 | MSX1 | 4487 | 205932_s_at | 0.0827 | 0.7578 | |
| GSE45670 | MSX1 | 4487 | 205932_s_at | 0.0433 | 0.9011 | |
| GSE53622 | MSX1 | 4487 | 8823 | 0.8303 | 0.0001 | |
| GSE53624 | MSX1 | 4487 | 8823 | 1.2592 | 0.0000 | |
| GSE63941 | MSX1 | 4487 | 205932_s_at | -0.6379 | 0.5294 | |
| GSE77861 | MSX1 | 4487 | 228473_at | 0.0359 | 0.7864 | |
| SRP064894 | MSX1 | 4487 | RNAseq | 1.0337 | 0.0154 | |
| SRP133303 | MSX1 | 4487 | RNAseq | 0.6816 | 0.0145 | |
| SRP159526 | MSX1 | 4487 | RNAseq | 1.9115 | 0.0000 | |
| SRP219564 | MSX1 | 4487 | RNAseq | 0.9626 | 0.2373 | |
| TCGA | MSX1 | 4487 | RNAseq | 0.3072 | 0.0789 |
Upregulated datasets: 4; Downregulated datasets: 0.
Survival by MSX1 expression:
 | 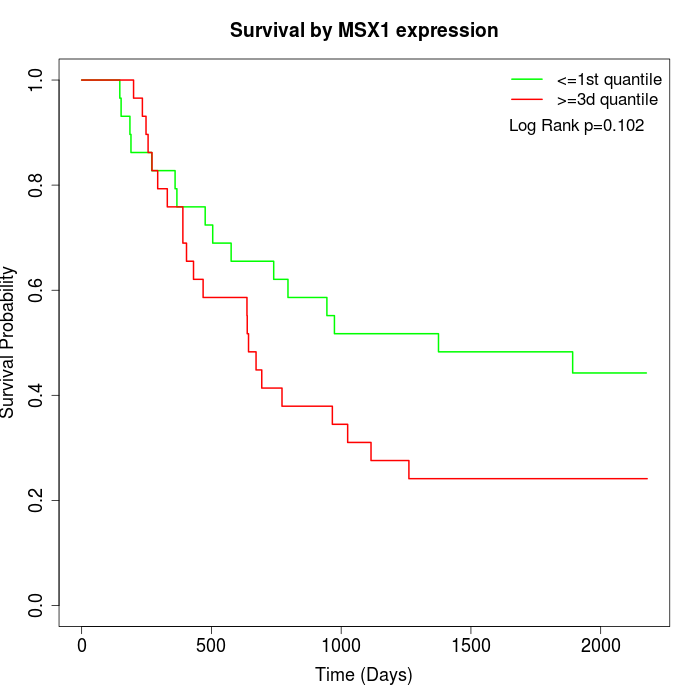 | 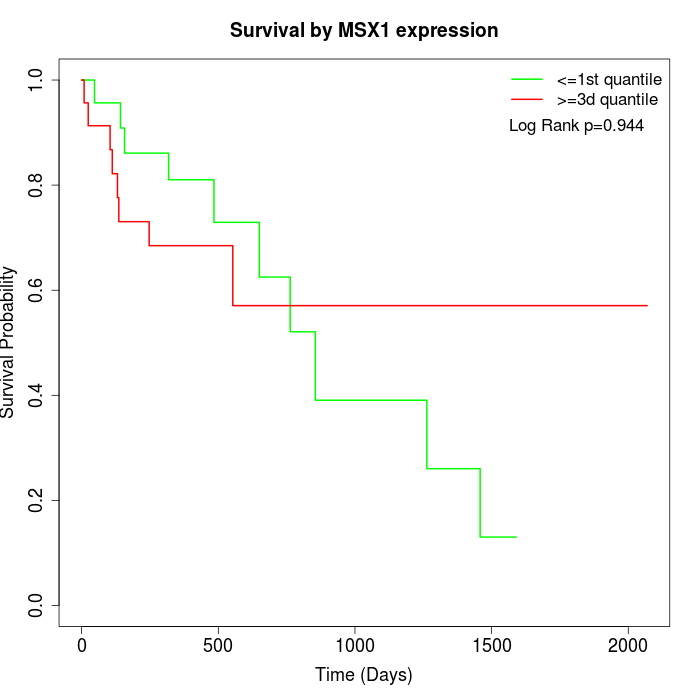 |
| GSE53622 | GSE53624 | TCGA |
Note: Click image to view full size file.
Copy number change of MSX1:
| Dataset | Gene | EntrezID | Gain | Loss | Normal | Detail |
|---|---|---|---|---|---|---|
| GSE15526 | MSX1 | 4487 | 0 | 17 | 13 | |
| GSE20123 | MSX1 | 4487 | 0 | 17 | 13 | |
| GSE43470 | MSX1 | 4487 | 0 | 16 | 27 | |
| GSE46452 | MSX1 | 4487 | 1 | 36 | 22 | |
| GSE47630 | MSX1 | 4487 | 1 | 19 | 20 | |
| GSE54993 | MSX1 | 4487 | 10 | 0 | 60 | |
| GSE54994 | MSX1 | 4487 | 3 | 12 | 38 | |
| GSE60625 | MSX1 | 4487 | 0 | 0 | 11 | |
| GSE74703 | MSX1 | 4487 | 0 | 13 | 23 | |
| GSE74704 | MSX1 | 4487 | 0 | 9 | 11 | |
| TCGA | MSX1 | 4487 | 7 | 47 | 42 |
Total number of gains: 22; Total number of losses: 186; Total Number of normals: 280.
Somatic mutations of MSX1:
Generating mutation plots.
Highly correlated genes for MSX1:
Showing top 20/129 corelated genes with mean PCC>0.5.
| Gene1 | Gene2 | Mean PCC | Num. Datasets | Num. PCC<0 | Num. PCC>0.5 |
|---|---|---|---|---|---|
| MSX1 | LIN28A | 0.670034 | 3 | 0 | 3 |
| MSX1 | AGAP2-AS1 | 0.657157 | 3 | 0 | 3 |
| MSX1 | ARSJ | 0.629419 | 4 | 0 | 4 |
| MSX1 | EID2B | 0.627227 | 3 | 0 | 3 |
| MSX1 | ZIC1 | 0.611898 | 3 | 0 | 3 |
| MSX1 | BCAR1 | 0.606138 | 3 | 0 | 3 |
| MSX1 | FGF20 | 0.604738 | 4 | 0 | 4 |
| MSX1 | PRR16 | 0.596616 | 4 | 0 | 3 |
| MSX1 | CYP46A1 | 0.595959 | 3 | 0 | 3 |
| MSX1 | SIVA1 | 0.59225 | 4 | 0 | 3 |
| MSX1 | KAT2A | 0.592017 | 4 | 0 | 3 |
| MSX1 | ZNF511 | 0.591717 | 4 | 0 | 3 |
| MSX1 | PKN3 | 0.576177 | 5 | 0 | 3 |
| MSX1 | CCL8 | 0.57489 | 4 | 0 | 3 |
| MSX1 | CILP2 | 0.570887 | 4 | 0 | 3 |
| MSX1 | RBM34 | 0.570136 | 4 | 0 | 3 |
| MSX1 | RTN4R | 0.569995 | 4 | 0 | 3 |
| MSX1 | NABP2 | 0.567189 | 4 | 0 | 3 |
| MSX1 | TMEM121 | 0.562793 | 4 | 0 | 3 |
| MSX1 | CLDN1 | 0.560848 | 3 | 0 | 3 |
For details and further investigation, click here