| Full name: EP300 interacting inhibitor of differentiation 2B | Alias Symbol: EID-3|FLJ38944 | ||
| Type: protein-coding gene | Cytoband: 19q13.2 | ||
| Entrez ID: 126272 | HGNC ID: HGNC:26796 | Ensembl Gene: ENSG00000176401 | OMIM ID: |
Expression of EID2B:
| Dataset | Gene | EntrezID | Probe | Log2FC | Adj.pValue | Expression |
|---|---|---|---|---|---|---|
| GSE17351 | EID2B | 126272 | 242470_at | -0.3064 | 0.5675 | |
| GSE26886 | EID2B | 126272 | 242470_at | 0.7128 | 0.0002 | |
| GSE45670 | EID2B | 126272 | 242470_at | -0.6496 | 0.0143 | |
| GSE53622 | EID2B | 126272 | 139347 | -0.0609 | 0.6920 | |
| GSE53624 | EID2B | 126272 | 139347 | 0.5638 | 0.0003 | |
| GSE63941 | EID2B | 126272 | 242470_at | -1.1226 | 0.1356 | |
| GSE77861 | EID2B | 126272 | 242470_at | 0.0503 | 0.6073 | |
| SRP064894 | EID2B | 126272 | RNAseq | 0.5462 | 0.0050 | |
| SRP133303 | EID2B | 126272 | RNAseq | 0.0799 | 0.7307 | |
| SRP159526 | EID2B | 126272 | RNAseq | 0.8017 | 0.0613 | |
| SRP193095 | EID2B | 126272 | RNAseq | 0.6200 | 0.0001 | |
| SRP219564 | EID2B | 126272 | RNAseq | -0.0487 | 0.9344 | |
| TCGA | EID2B | 126272 | RNAseq | -0.0769 | 0.6615 |
Upregulated datasets: 0; Downregulated datasets: 0.
Survival by EID2B expression:
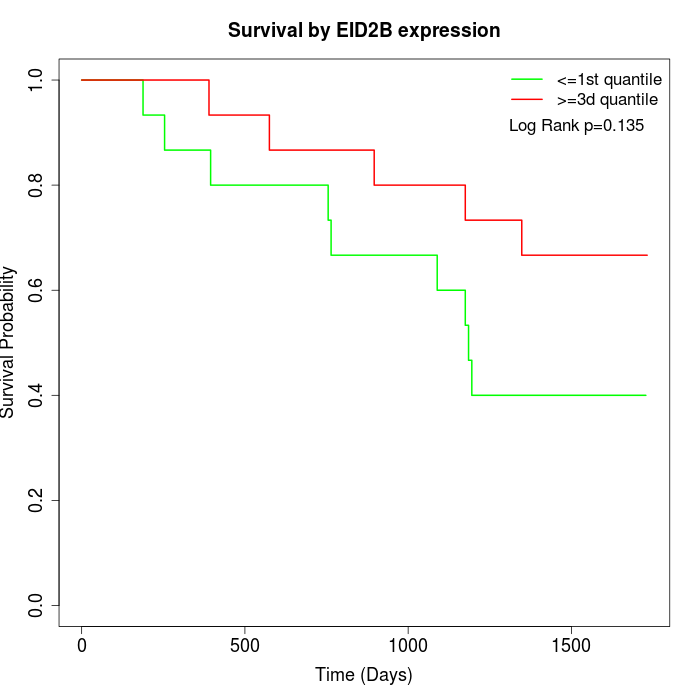 | 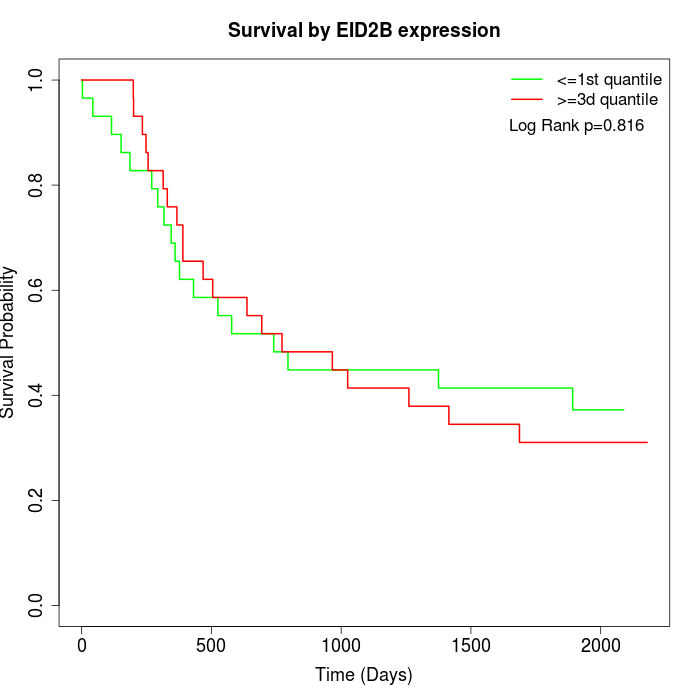 | 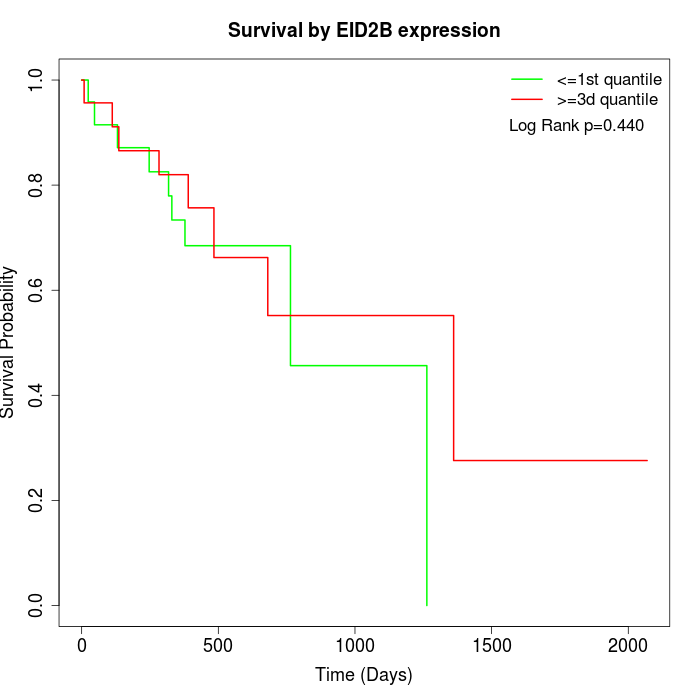 |
| GSE53622 | GSE53624 | TCGA |
Note: Click image to view full size file.
Copy number change of EID2B:
| Dataset | Gene | EntrezID | Gain | Loss | Normal | Detail |
|---|---|---|---|---|---|---|
| GSE15526 | EID2B | 126272 | 7 | 4 | 19 | |
| GSE20123 | EID2B | 126272 | 7 | 3 | 20 | |
| GSE43470 | EID2B | 126272 | 3 | 11 | 29 | |
| GSE46452 | EID2B | 126272 | 48 | 1 | 10 | |
| GSE47630 | EID2B | 126272 | 9 | 5 | 26 | |
| GSE54993 | EID2B | 126272 | 17 | 3 | 50 | |
| GSE54994 | EID2B | 126272 | 7 | 9 | 37 | |
| GSE60625 | EID2B | 126272 | 9 | 0 | 2 | |
| GSE74703 | EID2B | 126272 | 3 | 7 | 26 | |
| GSE74704 | EID2B | 126272 | 7 | 1 | 12 | |
| TCGA | EID2B | 126272 | 14 | 16 | 66 |
Total number of gains: 131; Total number of losses: 60; Total Number of normals: 297.
Somatic mutations of EID2B:
Generating mutation plots.
Highly correlated genes for EID2B:
Showing top 20/444 corelated genes with mean PCC>0.5.
| Gene1 | Gene2 | Mean PCC | Num. Datasets | Num. PCC<0 | Num. PCC>0.5 |
|---|---|---|---|---|---|
| EID2B | SDC2 | 0.760842 | 3 | 0 | 3 |
| EID2B | CPE | 0.715158 | 3 | 0 | 3 |
| EID2B | KIAA0408 | 0.714808 | 3 | 0 | 3 |
| EID2B | SGCB | 0.692189 | 6 | 0 | 6 |
| EID2B | ITGA5 | 0.68588 | 4 | 0 | 3 |
| EID2B | LIX1L | 0.683411 | 7 | 0 | 6 |
| EID2B | FBN1 | 0.681202 | 5 | 0 | 5 |
| EID2B | DCHS1 | 0.680704 | 5 | 0 | 4 |
| EID2B | BBS12 | 0.679878 | 4 | 0 | 4 |
| EID2B | DPYSL2 | 0.679088 | 4 | 0 | 3 |
| EID2B | MCAM | 0.677447 | 5 | 0 | 5 |
| EID2B | SNAPC1 | 0.676434 | 4 | 0 | 3 |
| EID2B | FKBP14 | 0.673857 | 4 | 0 | 4 |
| EID2B | VIM | 0.670935 | 6 | 0 | 5 |
| EID2B | BNC2 | 0.664704 | 4 | 0 | 3 |
| EID2B | FKBP11 | 0.664035 | 3 | 0 | 3 |
| EID2B | ITGBL1 | 0.654767 | 3 | 0 | 3 |
| EID2B | FERMT2 | 0.652517 | 6 | 0 | 5 |
| EID2B | IFT43 | 0.651975 | 3 | 0 | 3 |
| EID2B | TIMP2 | 0.651868 | 5 | 0 | 4 |
For details and further investigation, click here