| Full name: mitochondrial poly(A) polymerase | Alias Symbol: FLJ10486|mtPAP|SPAX4|TENT6 | ||
| Type: protein-coding gene | Cytoband: 10p11.23 | ||
| Entrez ID: 55149 | HGNC ID: HGNC:25532 | Ensembl Gene: ENSG00000107951 | OMIM ID: 613669 |
Screen Evidence:
| |||
Expression of MTPAP:
| Dataset | Gene | EntrezID | Probe | Log2FC | Adj.pValue | Expression |
|---|---|---|---|---|---|---|
| GSE17351 | MTPAP | 55149 | 222794_x_at | 0.3744 | 0.3911 | |
| GSE20347 | MTPAP | 55149 | 218947_s_at | 0.0525 | 0.7770 | |
| GSE23400 | MTPAP | 55149 | 218947_s_at | 0.4928 | 0.0000 | |
| GSE26886 | MTPAP | 55149 | 222794_x_at | 0.3861 | 0.0875 | |
| GSE29001 | MTPAP | 55149 | 218947_s_at | 0.4515 | 0.2363 | |
| GSE38129 | MTPAP | 55149 | 218947_s_at | 0.1874 | 0.1441 | |
| GSE45670 | MTPAP | 55149 | 222794_x_at | 0.2100 | 0.1835 | |
| GSE53622 | MTPAP | 55149 | 245 | 0.1039 | 0.1627 | |
| GSE53624 | MTPAP | 55149 | 245 | 0.2967 | 0.0018 | |
| GSE63941 | MTPAP | 55149 | 222794_x_at | 1.1140 | 0.0155 | |
| GSE77861 | MTPAP | 55149 | 222794_x_at | -0.0019 | 0.9956 | |
| GSE97050 | MTPAP | 55149 | A_23_P1145 | 0.0208 | 0.9419 | |
| SRP007169 | MTPAP | 55149 | RNAseq | 0.4800 | 0.2138 | |
| SRP008496 | MTPAP | 55149 | RNAseq | 0.3754 | 0.1372 | |
| SRP064894 | MTPAP | 55149 | RNAseq | 0.1255 | 0.4210 | |
| SRP133303 | MTPAP | 55149 | RNAseq | -0.0121 | 0.9015 | |
| SRP159526 | MTPAP | 55149 | RNAseq | -0.0664 | 0.8185 | |
| SRP193095 | MTPAP | 55149 | RNAseq | -0.0314 | 0.6872 | |
| SRP219564 | MTPAP | 55149 | RNAseq | 0.1776 | 0.4805 | |
| TCGA | MTPAP | 55149 | RNAseq | 0.0828 | 0.1531 |
Upregulated datasets: 1; Downregulated datasets: 0.
Survival by MTPAP expression:
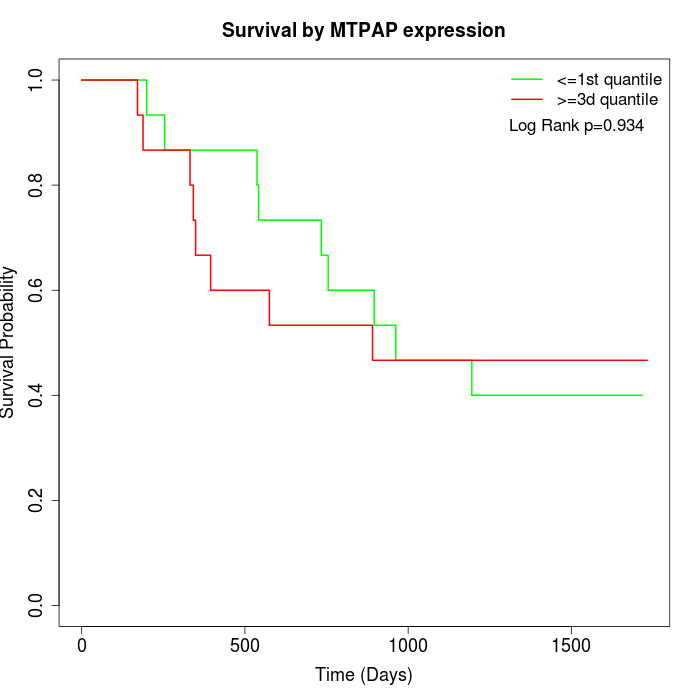 | 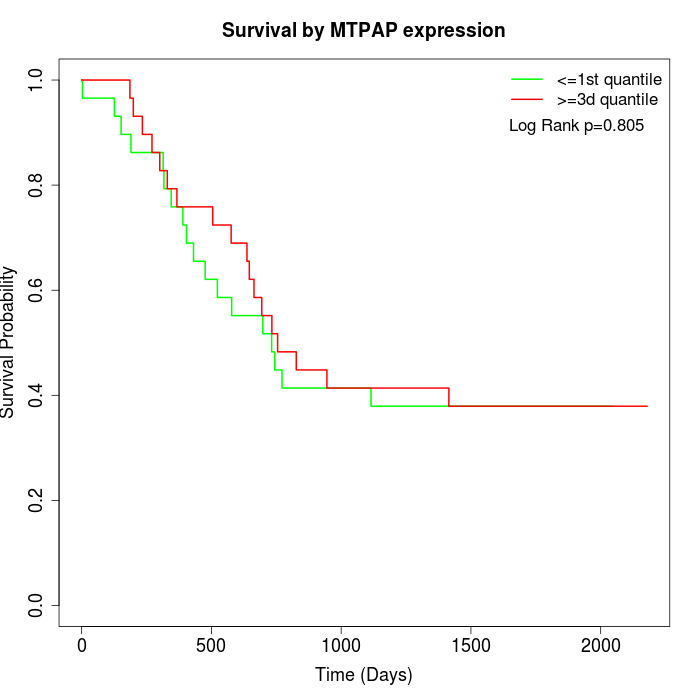 | 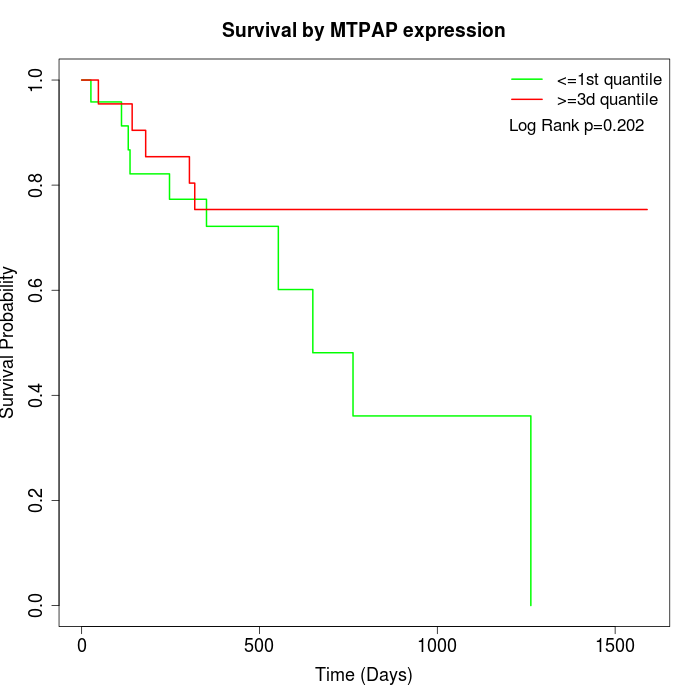 |
| GSE53622 | GSE53624 | TCGA |
Note: Click image to view full size file.
Copy number change of MTPAP:
| Dataset | Gene | EntrezID | Gain | Loss | Normal | Detail |
|---|---|---|---|---|---|---|
| GSE15526 | MTPAP | 55149 | 5 | 7 | 18 | |
| GSE20123 | MTPAP | 55149 | 5 | 6 | 19 | |
| GSE43470 | MTPAP | 55149 | 3 | 4 | 36 | |
| GSE46452 | MTPAP | 55149 | 1 | 14 | 44 | |
| GSE47630 | MTPAP | 55149 | 5 | 15 | 20 | |
| GSE54993 | MTPAP | 55149 | 9 | 0 | 61 | |
| GSE54994 | MTPAP | 55149 | 3 | 9 | 41 | |
| GSE60625 | MTPAP | 55149 | 0 | 0 | 11 | |
| GSE74703 | MTPAP | 55149 | 2 | 2 | 32 | |
| GSE74704 | MTPAP | 55149 | 0 | 5 | 15 | |
| TCGA | MTPAP | 55149 | 19 | 23 | 54 |
Total number of gains: 52; Total number of losses: 85; Total Number of normals: 351.
Somatic mutations of MTPAP:
Generating mutation plots.
Highly correlated genes for MTPAP:
Showing top 20/500 corelated genes with mean PCC>0.5.
| Gene1 | Gene2 | Mean PCC | Num. Datasets | Num. PCC<0 | Num. PCC>0.5 |
|---|---|---|---|---|---|
| MTPAP | TMEM237 | 0.83608 | 3 | 0 | 3 |
| MTPAP | WDR36 | 0.803048 | 3 | 0 | 3 |
| MTPAP | PSMB7 | 0.792941 | 3 | 0 | 3 |
| MTPAP | LYAR | 0.757613 | 3 | 0 | 3 |
| MTPAP | FKBP5 | 0.751111 | 3 | 0 | 3 |
| MTPAP | LANCL2 | 0.744316 | 3 | 0 | 3 |
| MTPAP | SCAF11 | 0.74261 | 3 | 0 | 3 |
| MTPAP | SLC25A40 | 0.742297 | 3 | 0 | 3 |
| MTPAP | PLEKHH1 | 0.740419 | 3 | 0 | 3 |
| MTPAP | ARFGEF2 | 0.735974 | 3 | 0 | 3 |
| MTPAP | CELF1 | 0.735627 | 4 | 0 | 4 |
| MTPAP | ZNF808 | 0.734412 | 3 | 0 | 3 |
| MTPAP | SAMD1 | 0.733427 | 3 | 0 | 3 |
| MTPAP | NEDD1 | 0.729473 | 3 | 0 | 3 |
| MTPAP | STRBP | 0.724325 | 3 | 0 | 3 |
| MTPAP | MAP4K5 | 0.724106 | 3 | 0 | 3 |
| MTPAP | MRPL32 | 0.717006 | 4 | 0 | 3 |
| MTPAP | RBM8A | 0.716393 | 4 | 0 | 4 |
| MTPAP | ZNF706 | 0.715427 | 3 | 0 | 3 |
| MTPAP | ANAPC4 | 0.714991 | 4 | 0 | 4 |
For details and further investigation, click here