| Full name: CUGBP Elav-like family member 1 | Alias Symbol: CUG-BP|hNab50|BRUNOL2|NAB50|CUGBP|NAPOR|EDEN-BP | ||
| Type: protein-coding gene | Cytoband: 11p11.2 | ||
| Entrez ID: 10658 | HGNC ID: HGNC:2549 | Ensembl Gene: ENSG00000149187 | OMIM ID: 601074 |
Screen Evidence:
| |||
Expression of CELF1:
| Dataset | Gene | EntrezID | Probe | Log2FC | Adj.pValue | Expression |
|---|---|---|---|---|---|---|
| GSE17351 | CELF1 | 10658 | 221743_at | 0.3305 | 0.3351 | |
| GSE20347 | CELF1 | 10658 | 221743_at | 0.3377 | 0.0008 | |
| GSE23400 | CELF1 | 10658 | 209489_at | -0.0691 | 0.2629 | |
| GSE26886 | CELF1 | 10658 | 221743_at | 0.2853 | 0.2440 | |
| GSE29001 | CELF1 | 10658 | 221743_at | 0.2040 | 0.3490 | |
| GSE38129 | CELF1 | 10658 | 221743_at | 0.2659 | 0.0035 | |
| GSE45670 | CELF1 | 10658 | 221743_at | 0.1396 | 0.1562 | |
| GSE53622 | CELF1 | 10658 | 156760 | 0.2412 | 0.0000 | |
| GSE53624 | CELF1 | 10658 | 39230 | 0.5041 | 0.0000 | |
| GSE63941 | CELF1 | 10658 | 221743_at | -0.1489 | 0.5811 | |
| GSE77861 | CELF1 | 10658 | 221743_at | 0.3928 | 0.0147 | |
| GSE97050 | CELF1 | 10658 | A_23_P318396 | 0.1345 | 0.5840 | |
| SRP007169 | CELF1 | 10658 | RNAseq | 0.3486 | 0.3423 | |
| SRP008496 | CELF1 | 10658 | RNAseq | 0.3639 | 0.0772 | |
| SRP064894 | CELF1 | 10658 | RNAseq | 0.2446 | 0.0451 | |
| SRP133303 | CELF1 | 10658 | RNAseq | 0.3331 | 0.0025 | |
| SRP159526 | CELF1 | 10658 | RNAseq | 0.1407 | 0.5809 | |
| SRP193095 | CELF1 | 10658 | RNAseq | 0.1601 | 0.0600 | |
| SRP219564 | CELF1 | 10658 | RNAseq | 0.1172 | 0.5271 | |
| TCGA | CELF1 | 10658 | RNAseq | 0.0227 | 0.6061 |
Upregulated datasets: 0; Downregulated datasets: 0.
Survival by CELF1 expression:
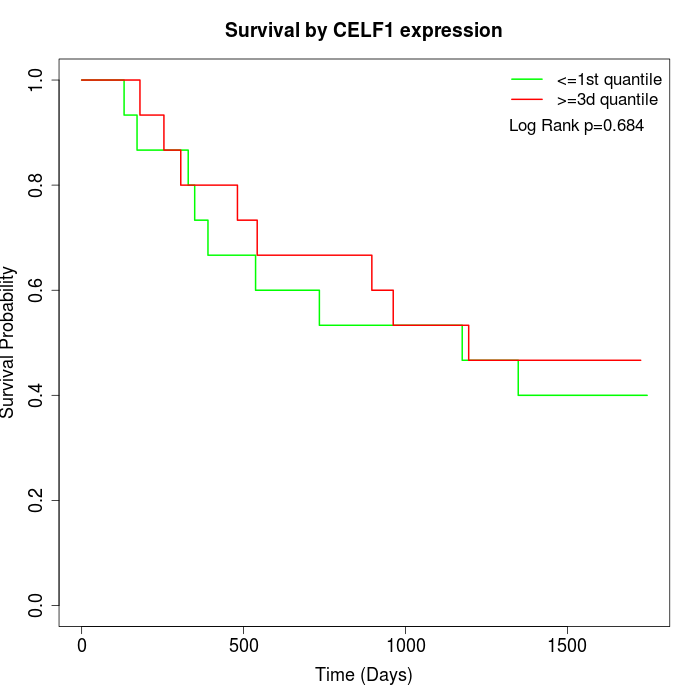 | 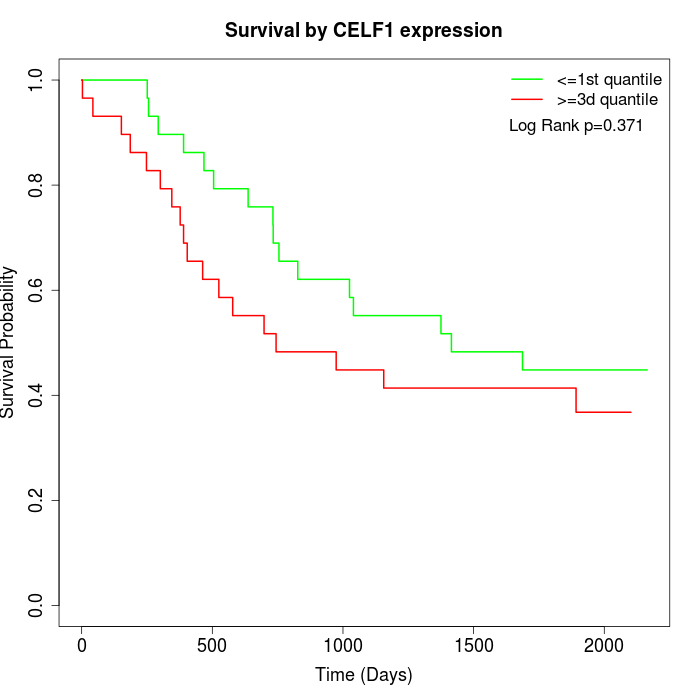 | 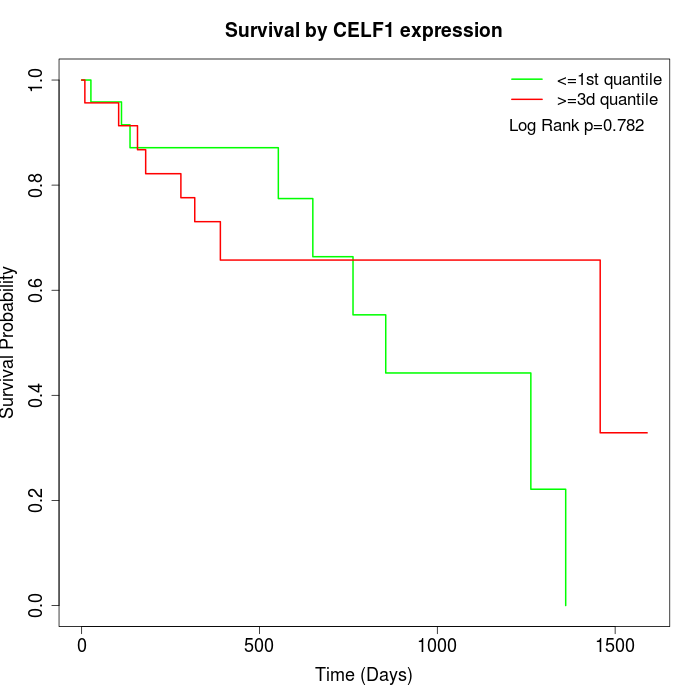 |
| GSE53622 | GSE53624 | TCGA |
Note: Click image to view full size file.
Copy number change of CELF1:
| Dataset | Gene | EntrezID | Gain | Loss | Normal | Detail |
|---|---|---|---|---|---|---|
| GSE15526 | CELF1 | 10658 | 3 | 7 | 20 | |
| GSE20123 | CELF1 | 10658 | 3 | 6 | 21 | |
| GSE43470 | CELF1 | 10658 | 1 | 4 | 38 | |
| GSE46452 | CELF1 | 10658 | 8 | 5 | 46 | |
| GSE47630 | CELF1 | 10658 | 3 | 9 | 28 | |
| GSE54993 | CELF1 | 10658 | 3 | 0 | 67 | |
| GSE54994 | CELF1 | 10658 | 1 | 11 | 41 | |
| GSE60625 | CELF1 | 10658 | 0 | 0 | 11 | |
| GSE74703 | CELF1 | 10658 | 1 | 2 | 33 | |
| GSE74704 | CELF1 | 10658 | 2 | 4 | 14 | |
| TCGA | CELF1 | 10658 | 10 | 20 | 66 |
Total number of gains: 35; Total number of losses: 68; Total Number of normals: 385.
Somatic mutations of CELF1:
Generating mutation plots.
Highly correlated genes for CELF1:
Showing top 20/987 corelated genes with mean PCC>0.5.
| Gene1 | Gene2 | Mean PCC | Num. Datasets | Num. PCC<0 | Num. PCC>0.5 |
|---|---|---|---|---|---|
| CELF1 | CRTC2 | 0.82367 | 3 | 0 | 3 |
| CELF1 | CCDC150 | 0.795522 | 3 | 0 | 3 |
| CELF1 | PLEKHA3 | 0.788816 | 3 | 0 | 3 |
| CELF1 | ANAPC4 | 0.787167 | 3 | 0 | 3 |
| CELF1 | PHOSPHO2 | 0.768442 | 3 | 0 | 3 |
| CELF1 | LMLN | 0.764788 | 4 | 0 | 4 |
| CELF1 | ZNF146 | 0.762845 | 6 | 0 | 6 |
| CELF1 | WDR75 | 0.761928 | 4 | 0 | 4 |
| CELF1 | NBEAL1 | 0.759861 | 3 | 0 | 3 |
| CELF1 | KLHL8 | 0.759598 | 3 | 0 | 3 |
| CELF1 | EXOSC10 | 0.751709 | 4 | 0 | 3 |
| CELF1 | ACSL1 | 0.74852 | 3 | 0 | 3 |
| CELF1 | NOM1 | 0.7457 | 4 | 0 | 4 |
| CELF1 | GAR1 | 0.745235 | 3 | 0 | 3 |
| CELF1 | PAK1IP1 | 0.743987 | 5 | 0 | 5 |
| CELF1 | DHX36 | 0.74208 | 5 | 0 | 4 |
| CELF1 | DDIT3 | 0.738095 | 3 | 0 | 3 |
| CELF1 | MTPAP | 0.735627 | 4 | 0 | 4 |
| CELF1 | EMG1 | 0.73538 | 3 | 0 | 3 |
| CELF1 | ALS2 | 0.734694 | 4 | 0 | 4 |
For details and further investigation, click here