| Full name: N(alpha)-acetyltransferase 11, NatA catalytic subunit | Alias Symbol: ARD2|hARD2 | ||
| Type: protein-coding gene | Cytoband: 4q21.21 | ||
| Entrez ID: 84779 | HGNC ID: HGNC:28125 | Ensembl Gene: ENSG00000156269 | OMIM ID: |
Expression of NAA11:
| Dataset | Gene | EntrezID | Probe | Log2FC | Adj.pValue | Expression |
|---|---|---|---|---|---|---|
| GSE17351 | NAA11 | 84779 | 210603_at | -0.0177 | 0.9581 | |
| GSE20347 | NAA11 | 84779 | 210603_at | 0.1811 | 0.0388 | |
| GSE23400 | NAA11 | 84779 | 210603_at | -0.1206 | 0.0111 | |
| GSE26886 | NAA11 | 84779 | 210603_at | 0.0667 | 0.5804 | |
| GSE29001 | NAA11 | 84779 | 210603_at | 0.3308 | 0.2303 | |
| GSE38129 | NAA11 | 84779 | 210603_at | 0.0444 | 0.6623 | |
| GSE45670 | NAA11 | 84779 | 210603_at | 0.2853 | 0.1982 | |
| GSE53622 | NAA11 | 84779 | 34605 | 0.4616 | 0.0000 | |
| GSE53624 | NAA11 | 84779 | 34605 | 0.6962 | 0.0000 | |
| GSE63941 | NAA11 | 84779 | 210603_at | 0.2215 | 0.0903 | |
| GSE77861 | NAA11 | 84779 | 210603_at | -0.1028 | 0.5042 | |
| GSE97050 | NAA11 | 84779 | A_23_P155890 | 0.1546 | 0.5131 | |
| SRP133303 | NAA11 | 84779 | RNAseq | 0.2503 | 0.2387 | |
| TCGA | NAA11 | 84779 | RNAseq | 4.3115 | 0.0268 |
Upregulated datasets: 1; Downregulated datasets: 0.
Survival by NAA11 expression:
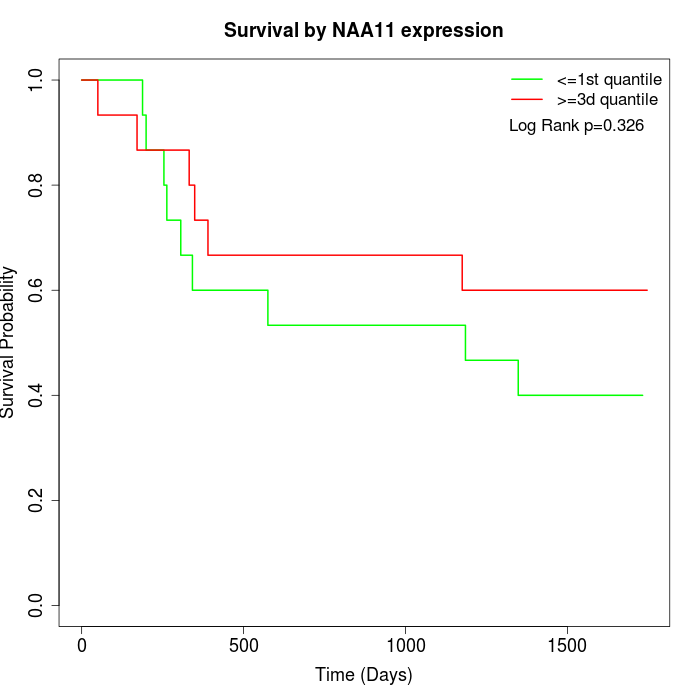 | 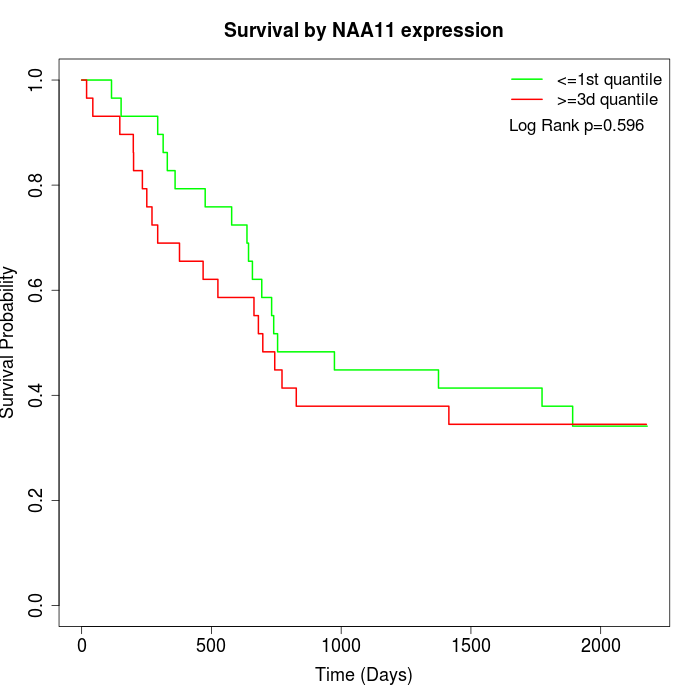 | 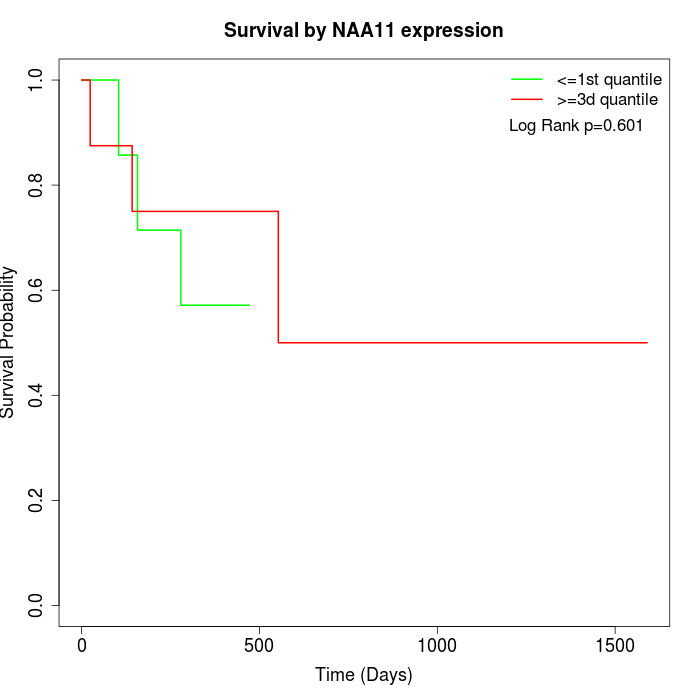 |
| GSE53622 | GSE53624 | TCGA |
Note: Click image to view full size file.
Copy number change of NAA11:
| Dataset | Gene | EntrezID | Gain | Loss | Normal | Detail |
|---|---|---|---|---|---|---|
| GSE15526 | NAA11 | 84779 | 1 | 10 | 19 | |
| GSE20123 | NAA11 | 84779 | 1 | 10 | 19 | |
| GSE43470 | NAA11 | 84779 | 0 | 13 | 30 | |
| GSE46452 | NAA11 | 84779 | 1 | 36 | 22 | |
| GSE47630 | NAA11 | 84779 | 1 | 19 | 20 | |
| GSE54993 | NAA11 | 84779 | 8 | 0 | 62 | |
| GSE54994 | NAA11 | 84779 | 0 | 9 | 44 | |
| GSE60625 | NAA11 | 84779 | 0 | 0 | 11 | |
| GSE74703 | NAA11 | 84779 | 0 | 11 | 25 | |
| GSE74704 | NAA11 | 84779 | 1 | 6 | 13 | |
| TCGA | NAA11 | 84779 | 12 | 34 | 50 |
Total number of gains: 25; Total number of losses: 148; Total Number of normals: 315.
Somatic mutations of NAA11:
Generating mutation plots.
Highly correlated genes for NAA11:
Showing top 20/436 corelated genes with mean PCC>0.5.
| Gene1 | Gene2 | Mean PCC | Num. Datasets | Num. PCC<0 | Num. PCC>0.5 |
|---|---|---|---|---|---|
| NAA11 | LAGE3 | 0.738084 | 3 | 0 | 3 |
| NAA11 | GDI1 | 0.729465 | 4 | 0 | 4 |
| NAA11 | EBNA1BP2 | 0.721539 | 3 | 0 | 3 |
| NAA11 | KCNMB4 | 0.7157 | 3 | 0 | 3 |
| NAA11 | TTC4 | 0.714653 | 3 | 0 | 3 |
| NAA11 | CCM2 | 0.703652 | 3 | 0 | 3 |
| NAA11 | ADAM7 | 0.702673 | 3 | 0 | 3 |
| NAA11 | KTI12 | 0.696492 | 3 | 0 | 3 |
| NAA11 | BOLA3 | 0.695059 | 3 | 0 | 3 |
| NAA11 | MRPL36 | 0.693696 | 3 | 0 | 3 |
| NAA11 | BTN1A1 | 0.691419 | 5 | 0 | 5 |
| NAA11 | ACOT7 | 0.689563 | 3 | 0 | 3 |
| NAA11 | NKAP | 0.687892 | 3 | 0 | 3 |
| NAA11 | SLC6A6 | 0.686831 | 3 | 0 | 3 |
| NAA11 | CAV2 | 0.68554 | 3 | 0 | 3 |
| NAA11 | CGA | 0.683876 | 4 | 0 | 4 |
| NAA11 | ANLN | 0.683538 | 3 | 0 | 3 |
| NAA11 | DCHS2 | 0.683444 | 6 | 0 | 6 |
| NAA11 | WDR54 | 0.683111 | 3 | 0 | 3 |
| NAA11 | MYO5A | 0.682982 | 3 | 0 | 3 |
For details and further investigation, click here