| Full name: NPC1 like intracellular cholesterol transporter 1 | Alias Symbol: SLC65A2 | ||
| Type: protein-coding gene | Cytoband: 7p13 | ||
| Entrez ID: 29881 | HGNC ID: HGNC:7898 | Ensembl Gene: ENSG00000015520 | OMIM ID: 608010 |
| Related drugs: EZETIMIBE... [more] | |||
Screen Evidence:
| |||
Expression of NPC1L1:
| Dataset | Gene | EntrezID | Probe | Log2FC | Adj.pValue | Expression |
|---|---|---|---|---|---|---|
| GSE17351 | NPC1L1 | 29881 | 220106_at | -0.0942 | 0.7593 | |
| GSE20347 | NPC1L1 | 29881 | 220106_at | -0.0666 | 0.4077 | |
| GSE23400 | NPC1L1 | 29881 | 220106_at | -0.1816 | 0.0002 | |
| GSE26886 | NPC1L1 | 29881 | 220106_at | -0.0314 | 0.9184 | |
| GSE29001 | NPC1L1 | 29881 | 220106_at | -0.5227 | 0.0056 | |
| GSE38129 | NPC1L1 | 29881 | 220106_at | -0.1350 | 0.3097 | |
| GSE45670 | NPC1L1 | 29881 | 220106_at | 0.2113 | 0.0405 | |
| GSE53622 | NPC1L1 | 29881 | 27987 | -0.8875 | 0.0000 | |
| GSE53624 | NPC1L1 | 29881 | 27987 | -1.5979 | 0.0000 | |
| GSE63941 | NPC1L1 | 29881 | 220106_at | -0.0277 | 0.8694 | |
| GSE77861 | NPC1L1 | 29881 | 220106_at | -0.0942 | 0.5174 | |
| SRP133303 | NPC1L1 | 29881 | RNAseq | -0.6570 | 0.0236 | |
| SRP159526 | NPC1L1 | 29881 | RNAseq | -1.6523 | 0.0234 | |
| SRP219564 | NPC1L1 | 29881 | RNAseq | -0.3404 | 0.5046 | |
| TCGA | NPC1L1 | 29881 | RNAseq | -1.1361 | 0.0026 |
Upregulated datasets: 0; Downregulated datasets: 3.
Survival by NPC1L1 expression:
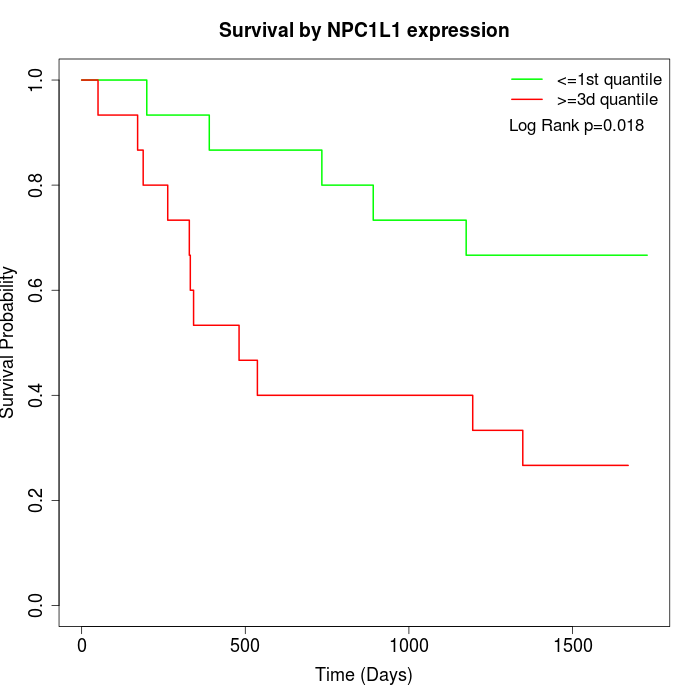 | 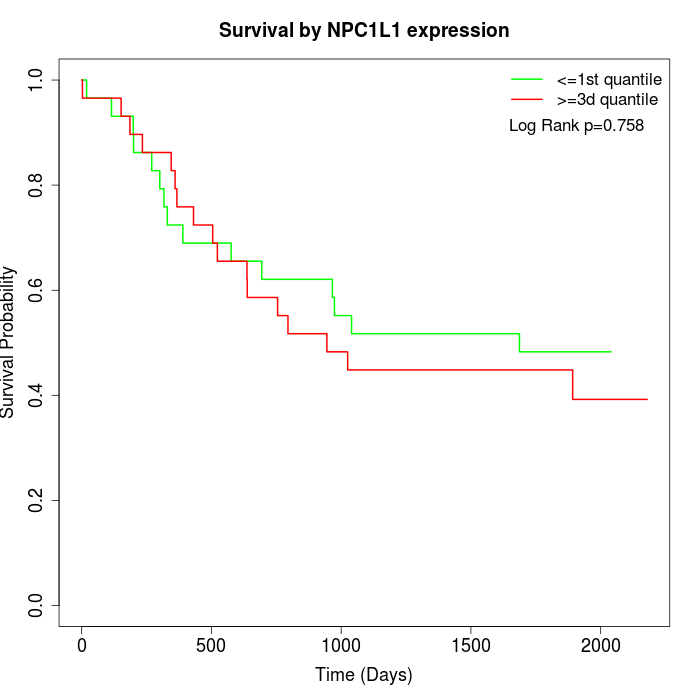 | 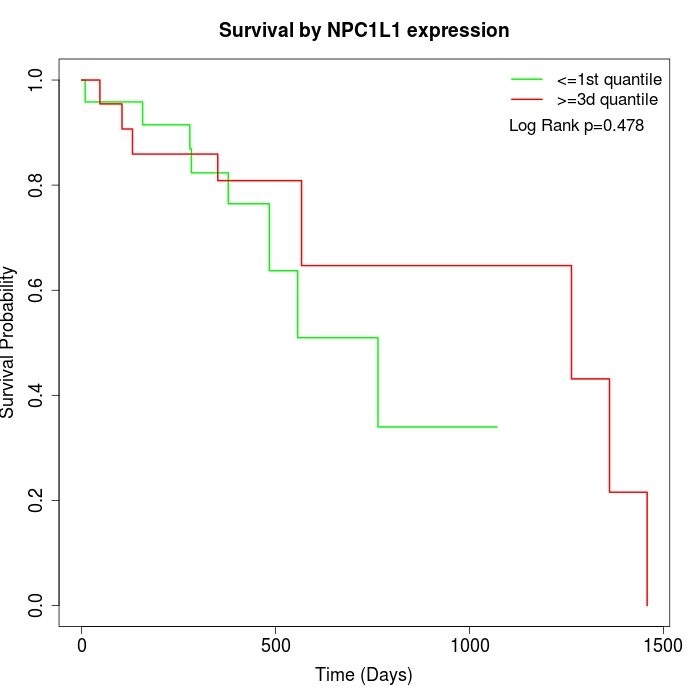 |
| GSE53622 | GSE53624 | TCGA |
Note: Click image to view full size file.
Copy number change of NPC1L1:
| Dataset | Gene | EntrezID | Gain | Loss | Normal | Detail |
|---|---|---|---|---|---|---|
| GSE15526 | NPC1L1 | 29881 | 14 | 0 | 16 | |
| GSE20123 | NPC1L1 | 29881 | 13 | 0 | 17 | |
| GSE43470 | NPC1L1 | 29881 | 4 | 0 | 39 | |
| GSE46452 | NPC1L1 | 29881 | 11 | 1 | 47 | |
| GSE47630 | NPC1L1 | 29881 | 8 | 1 | 31 | |
| GSE54993 | NPC1L1 | 29881 | 0 | 8 | 62 | |
| GSE54994 | NPC1L1 | 29881 | 16 | 3 | 34 | |
| GSE60625 | NPC1L1 | 29881 | 0 | 0 | 11 | |
| GSE74703 | NPC1L1 | 29881 | 4 | 0 | 32 | |
| GSE74704 | NPC1L1 | 29881 | 7 | 0 | 13 | |
| TCGA | NPC1L1 | 29881 | 50 | 7 | 39 |
Total number of gains: 127; Total number of losses: 20; Total Number of normals: 341.
Somatic mutations of NPC1L1:
Generating mutation plots.
Highly correlated genes for NPC1L1:
Showing top 20/436 corelated genes with mean PCC>0.5.
| Gene1 | Gene2 | Mean PCC | Num. Datasets | Num. PCC<0 | Num. PCC>0.5 |
|---|---|---|---|---|---|
| NPC1L1 | IFNA10 | 0.670898 | 3 | 0 | 3 |
| NPC1L1 | UMOD | 0.669812 | 3 | 0 | 3 |
| NPC1L1 | CRHR2 | 0.669179 | 4 | 0 | 4 |
| NPC1L1 | DNTT | 0.664938 | 3 | 0 | 3 |
| NPC1L1 | ZNF835 | 0.657504 | 3 | 0 | 3 |
| NPC1L1 | PLA2G2E | 0.652859 | 3 | 0 | 3 |
| NPC1L1 | N4BP3 | 0.647904 | 4 | 0 | 4 |
| NPC1L1 | VWA7 | 0.646318 | 3 | 0 | 3 |
| NPC1L1 | BRSK1 | 0.642986 | 3 | 0 | 3 |
| NPC1L1 | IFNA8 | 0.642972 | 3 | 0 | 3 |
| NPC1L1 | DEFA4 | 0.636324 | 3 | 0 | 3 |
| NPC1L1 | NPAP1 | 0.634322 | 3 | 0 | 3 |
| NPC1L1 | RANBP9 | 0.634004 | 3 | 0 | 3 |
| NPC1L1 | MS4A12 | 0.63394 | 3 | 0 | 3 |
| NPC1L1 | DNAH6 | 0.63172 | 4 | 0 | 4 |
| NPC1L1 | IL12A-AS1 | 0.628806 | 3 | 0 | 3 |
| NPC1L1 | GDF2 | 0.628565 | 4 | 0 | 4 |
| NPC1L1 | ANGPT4 | 0.62841 | 3 | 0 | 3 |
| NPC1L1 | APOL5 | 0.628256 | 5 | 0 | 3 |
| NPC1L1 | FTCD | 0.625763 | 5 | 0 | 4 |
For details and further investigation, click here