| Full name: phospholipase A2 group IIE | Alias Symbol: | ||
| Type: protein-coding gene | Cytoband: 1p36.13 | ||
| Entrez ID: 30814 | HGNC ID: HGNC:13414 | Ensembl Gene: ENSG00000188784 | OMIM ID: 618320 |
PLA2G2E involved pathways:
| KEGG pathway | Description | View |
|---|---|---|
| hsa04014 | Ras signaling pathway | |
| hsa04270 | Vascular smooth muscle contraction |
Expression of PLA2G2E:
| Dataset | Gene | EntrezID | Probe | Log2FC | Adj.pValue | Expression |
|---|---|---|---|---|---|---|
| GSE17351 | PLA2G2E | 30814 | 221389_at | 0.0065 | 0.9846 | |
| GSE20347 | PLA2G2E | 30814 | 221389_at | -0.1403 | 0.0265 | |
| GSE23400 | PLA2G2E | 30814 | 221389_at | -0.2108 | 0.0000 | |
| GSE26886 | PLA2G2E | 30814 | 221389_at | 0.1871 | 0.0459 | |
| GSE29001 | PLA2G2E | 30814 | 221389_at | -0.2492 | 0.0417 | |
| GSE38129 | PLA2G2E | 30814 | 221389_at | -0.1436 | 0.0173 | |
| GSE45670 | PLA2G2E | 30814 | 221389_at | -0.0435 | 0.6767 | |
| GSE53622 | PLA2G2E | 30814 | 61865 | 0.3300 | 0.0185 | |
| GSE53624 | PLA2G2E | 30814 | 61865 | 0.3293 | 0.0028 | |
| GSE63941 | PLA2G2E | 30814 | 221389_at | 0.1298 | 0.3883 | |
| GSE77861 | PLA2G2E | 30814 | 221389_at | -0.1053 | 0.4540 |
Upregulated datasets: 0; Downregulated datasets: 0.
Survival by PLA2G2E expression:
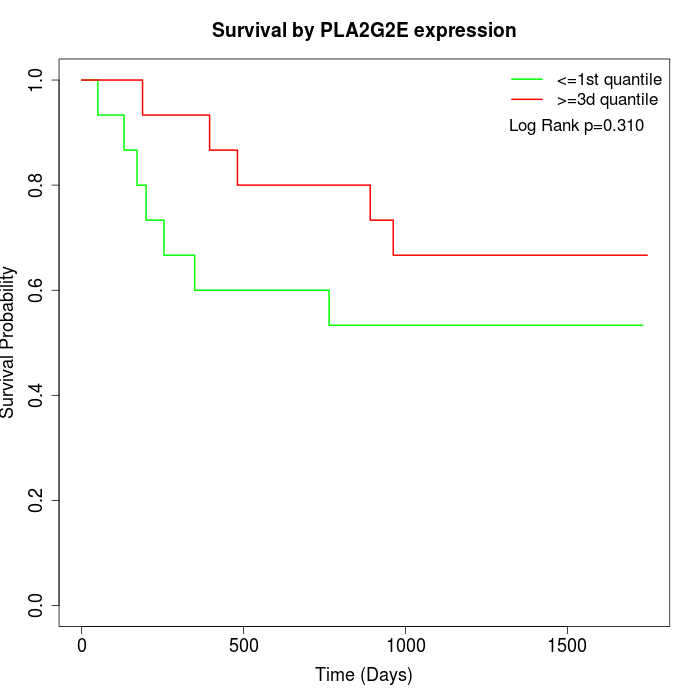 | 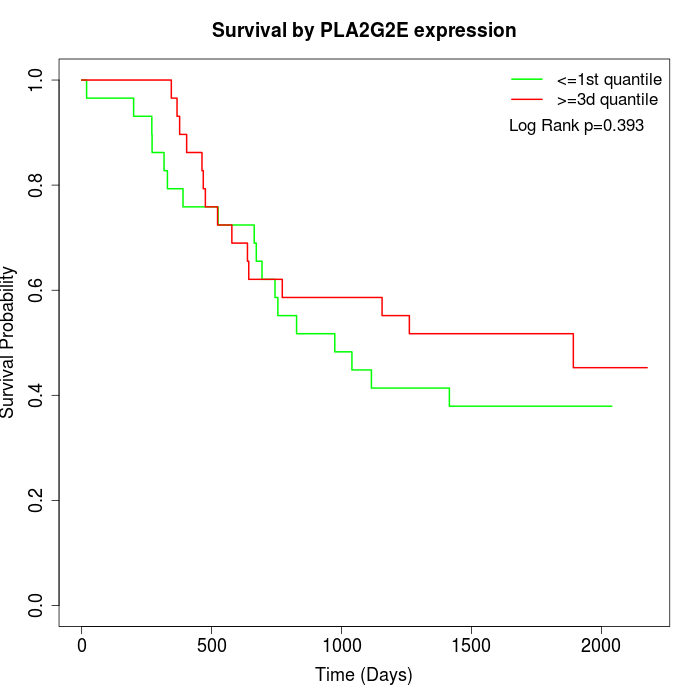 | 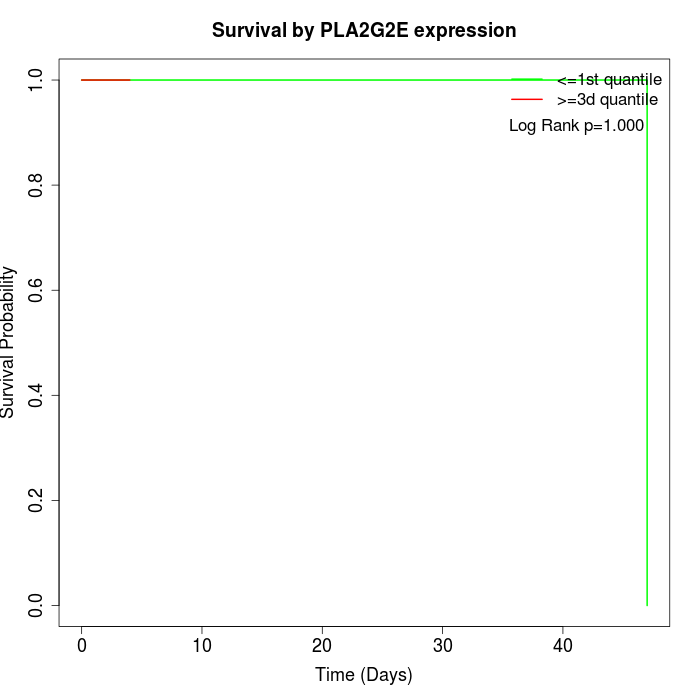 |
| GSE53622 | GSE53624 | TCGA |
Note: Click image to view full size file.
Copy number change of PLA2G2E:
| Dataset | Gene | EntrezID | Gain | Loss | Normal | Detail |
|---|---|---|---|---|---|---|
| GSE15526 | PLA2G2E | 30814 | 0 | 5 | 25 | |
| GSE20123 | PLA2G2E | 30814 | 0 | 4 | 26 | |
| GSE43470 | PLA2G2E | 30814 | 0 | 8 | 35 | |
| GSE46452 | PLA2G2E | 30814 | 5 | 1 | 53 | |
| GSE47630 | PLA2G2E | 30814 | 8 | 3 | 29 | |
| GSE54993 | PLA2G2E | 30814 | 3 | 1 | 66 | |
| GSE54994 | PLA2G2E | 30814 | 11 | 4 | 38 | |
| GSE60625 | PLA2G2E | 30814 | 0 | 0 | 11 | |
| GSE74703 | PLA2G2E | 30814 | 0 | 5 | 31 | |
| GSE74704 | PLA2G2E | 30814 | 0 | 0 | 20 | |
| TCGA | PLA2G2E | 30814 | 10 | 22 | 64 |
Total number of gains: 37; Total number of losses: 53; Total Number of normals: 398.
Somatic mutations of PLA2G2E:
Generating mutation plots.
Highly correlated genes for PLA2G2E:
Showing top 20/678 corelated genes with mean PCC>0.5.
| Gene1 | Gene2 | Mean PCC | Num. Datasets | Num. PCC<0 | Num. PCC>0.5 |
|---|---|---|---|---|---|
| PLA2G2E | OR2J2 | 0.728006 | 3 | 0 | 3 |
| PLA2G2E | CCR4 | 0.676643 | 3 | 0 | 3 |
| PLA2G2E | ZMAT4 | 0.674108 | 3 | 0 | 3 |
| PLA2G2E | XCR1 | 0.668188 | 5 | 0 | 5 |
| PLA2G2E | CAV3 | 0.659765 | 5 | 0 | 5 |
| PLA2G2E | FGF4 | 0.655931 | 4 | 0 | 4 |
| PLA2G2E | LALBA | 0.654311 | 4 | 0 | 4 |
| PLA2G2E | NPC1L1 | 0.652859 | 3 | 0 | 3 |
| PLA2G2E | GABRG3 | 0.6501 | 3 | 0 | 3 |
| PLA2G2E | GLRA2 | 0.648673 | 4 | 0 | 3 |
| PLA2G2E | CD1B | 0.646139 | 4 | 0 | 4 |
| PLA2G2E | GABRD | 0.644088 | 3 | 0 | 3 |
| PLA2G2E | DGCR9 | 0.6412 | 4 | 0 | 4 |
| PLA2G2E | KLK3 | 0.636417 | 5 | 0 | 5 |
| PLA2G2E | MATN1 | 0.636199 | 3 | 0 | 3 |
| PLA2G2E | CKM | 0.634732 | 4 | 0 | 4 |
| PLA2G2E | OR6A2 | 0.634121 | 5 | 0 | 4 |
| PLA2G2E | MED31 | 0.633058 | 4 | 0 | 4 |
| PLA2G2E | NPAP1 | 0.632837 | 5 | 0 | 5 |
| PLA2G2E | GJA8 | 0.632078 | 5 | 0 | 5 |
For details and further investigation, click here