| Full name: musashi RNA binding protein 1 | Alias Symbol: | ||
| Type: protein-coding gene | Cytoband: 12q24.31 | ||
| Entrez ID: 4440 | HGNC ID: HGNC:7330 | Ensembl Gene: ENSG00000135097 | OMIM ID: 603328 |
Expression of MSI1:
| Dataset | Gene | EntrezID | Probe | Log2FC | Adj.pValue | Expression |
|---|---|---|---|---|---|---|
| GSE17351 | MSI1 | 4440 | 206333_at | 0.2051 | 0.3234 | |
| GSE20347 | MSI1 | 4440 | 206333_at | 0.0479 | 0.3479 | |
| GSE23400 | MSI1 | 4440 | 206333_at | -0.0637 | 0.0279 | |
| GSE26886 | MSI1 | 4440 | 206333_at | 0.3239 | 0.0082 | |
| GSE29001 | MSI1 | 4440 | 206333_at | 0.0098 | 0.9604 | |
| GSE38129 | MSI1 | 4440 | 206333_at | 0.0448 | 0.6557 | |
| GSE45670 | MSI1 | 4440 | 206333_at | 0.0051 | 0.9653 | |
| GSE53622 | MSI1 | 4440 | 3388 | 1.0613 | 0.0000 | |
| GSE53624 | MSI1 | 4440 | 20821 | 0.9863 | 0.0000 | |
| GSE63941 | MSI1 | 4440 | 206333_at | 0.3216 | 0.1864 | |
| GSE77861 | MSI1 | 4440 | 206333_at | -0.0872 | 0.3486 | |
| GSE97050 | MSI1 | 4440 | A_23_P139795 | 0.0303 | 0.9370 | |
| SRP133303 | MSI1 | 4440 | RNAseq | 0.9998 | 0.0024 | |
| SRP159526 | MSI1 | 4440 | RNAseq | 4.0361 | 0.0000 | |
| SRP193095 | MSI1 | 4440 | RNAseq | 0.7743 | 0.0007 | |
| TCGA | MSI1 | 4440 | RNAseq | -0.1054 | 0.7882 |
Upregulated datasets: 2; Downregulated datasets: 0.
Survival by MSI1 expression:
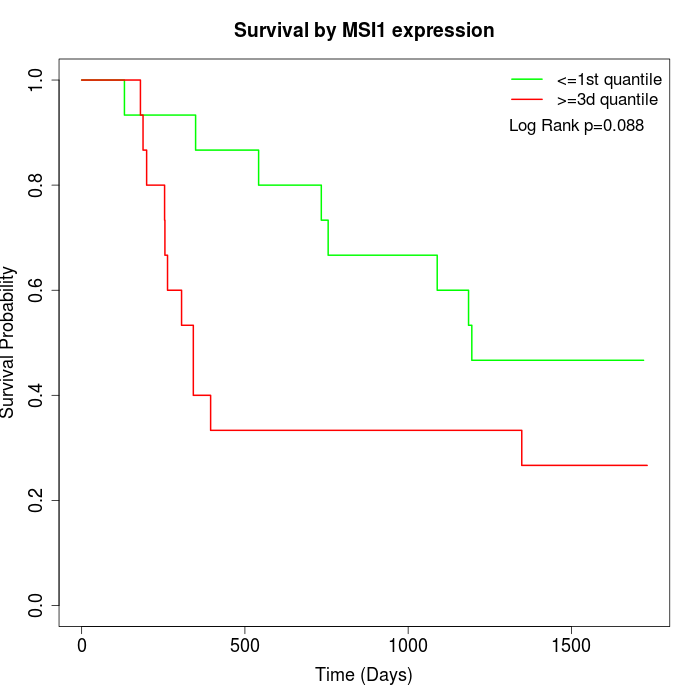 | 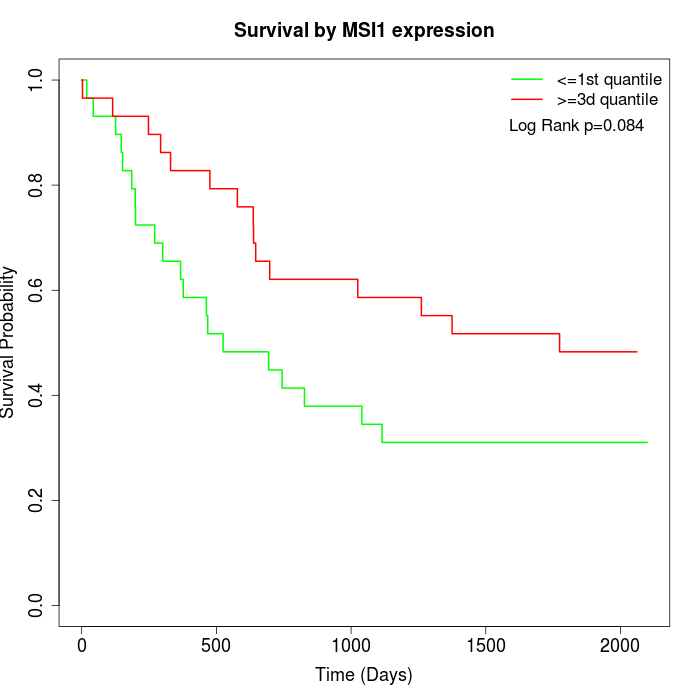 | 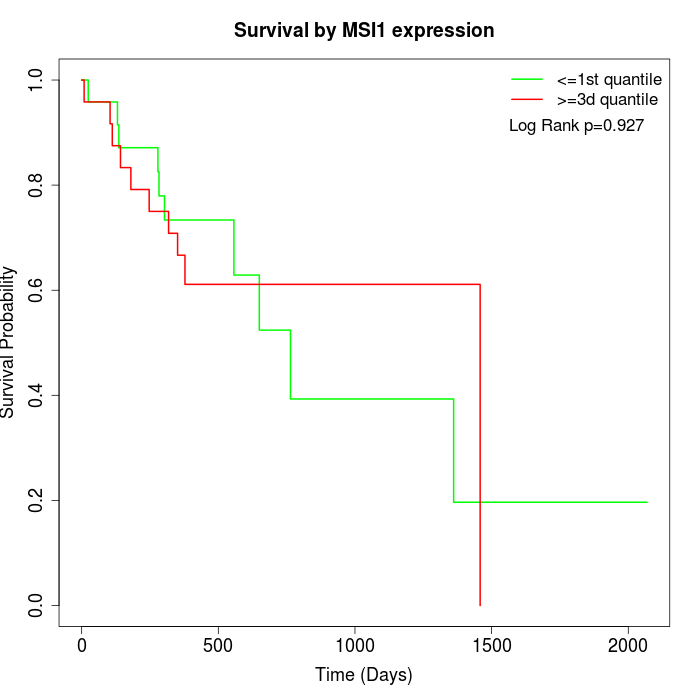 |
| GSE53622 | GSE53624 | TCGA |
Note: Click image to view full size file.
Copy number change of MSI1:
| Dataset | Gene | EntrezID | Gain | Loss | Normal | Detail |
|---|---|---|---|---|---|---|
| GSE15526 | MSI1 | 4440 | 6 | 2 | 22 | |
| GSE20123 | MSI1 | 4440 | 6 | 2 | 22 | |
| GSE43470 | MSI1 | 4440 | 2 | 2 | 39 | |
| GSE46452 | MSI1 | 4440 | 9 | 1 | 49 | |
| GSE47630 | MSI1 | 4440 | 9 | 3 | 28 | |
| GSE54993 | MSI1 | 4440 | 0 | 5 | 65 | |
| GSE54994 | MSI1 | 4440 | 7 | 6 | 40 | |
| GSE60625 | MSI1 | 4440 | 0 | 0 | 11 | |
| GSE74703 | MSI1 | 4440 | 2 | 1 | 33 | |
| GSE74704 | MSI1 | 4440 | 3 | 2 | 15 | |
| TCGA | MSI1 | 4440 | 21 | 10 | 65 |
Total number of gains: 65; Total number of losses: 34; Total Number of normals: 389.
Somatic mutations of MSI1:
Generating mutation plots.
Highly correlated genes for MSI1:
Showing top 20/582 corelated genes with mean PCC>0.5.
| Gene1 | Gene2 | Mean PCC | Num. Datasets | Num. PCC<0 | Num. PCC>0.5 |
|---|---|---|---|---|---|
| MSI1 | NPFFR1 | 0.732761 | 5 | 0 | 5 |
| MSI1 | SIVA1 | 0.71314 | 3 | 0 | 3 |
| MSI1 | CLSTN2 | 0.713051 | 3 | 0 | 3 |
| MSI1 | STAC | 0.700918 | 3 | 0 | 3 |
| MSI1 | ADAM2 | 0.699686 | 4 | 0 | 4 |
| MSI1 | FZR1 | 0.690158 | 3 | 0 | 3 |
| MSI1 | NR2E3 | 0.689406 | 4 | 0 | 4 |
| MSI1 | OR10H3 | 0.688052 | 3 | 0 | 3 |
| MSI1 | LGALS14 | 0.683159 | 3 | 0 | 3 |
| MSI1 | PPM1E | 0.682385 | 3 | 0 | 3 |
| MSI1 | IL3RA | 0.681935 | 5 | 0 | 5 |
| MSI1 | ARHGAP4 | 0.679373 | 3 | 0 | 3 |
| MSI1 | INSL5 | 0.67762 | 3 | 0 | 3 |
| MSI1 | FRS3 | 0.676242 | 3 | 0 | 3 |
| MSI1 | KRT38 | 0.673876 | 3 | 0 | 3 |
| MSI1 | MZF1 | 0.670856 | 4 | 0 | 4 |
| MSI1 | HAO1 | 0.668027 | 3 | 0 | 3 |
| MSI1 | KIR2DS5 | 0.665618 | 3 | 0 | 3 |
| MSI1 | TP53I11 | 0.665126 | 4 | 0 | 3 |
| MSI1 | IHH | 0.664797 | 4 | 0 | 4 |
For details and further investigation, click here