| Full name: Obg like ATPase 1 | Alias Symbol: PTD004 | ||
| Type: protein-coding gene | Cytoband: 2q31.1 | ||
| Entrez ID: 29789 | HGNC ID: HGNC:28833 | Ensembl Gene: ENSG00000138430 | OMIM ID: 611175 |
Screen Evidence:
| |||
Expression of OLA1:
| Dataset | Gene | EntrezID | Probe | Log2FC | Adj.pValue | Expression |
|---|---|---|---|---|---|---|
| GSE17351 | OLA1 | 29789 | 219293_s_at | 0.6448 | 0.1613 | |
| GSE20347 | OLA1 | 29789 | 219293_s_at | 0.3921 | 0.0291 | |
| GSE23400 | OLA1 | 29789 | 219293_s_at | 0.4855 | 0.0000 | |
| GSE26886 | OLA1 | 29789 | 219293_s_at | 0.7077 | 0.0000 | |
| GSE29001 | OLA1 | 29789 | 219293_s_at | 0.1207 | 0.6140 | |
| GSE38129 | OLA1 | 29789 | 219293_s_at | 0.5784 | 0.0005 | |
| GSE45670 | OLA1 | 29789 | 219293_s_at | 0.2285 | 0.0681 | |
| GSE53622 | OLA1 | 29789 | 31475 | 0.4190 | 0.0000 | |
| GSE53624 | OLA1 | 29789 | 31475 | 0.5564 | 0.0000 | |
| GSE63941 | OLA1 | 29789 | 219293_s_at | 0.4772 | 0.0662 | |
| GSE77861 | OLA1 | 29789 | 219293_s_at | 0.2909 | 0.0297 | |
| GSE97050 | OLA1 | 29789 | A_23_P28420 | 0.4391 | 0.1657 | |
| SRP007169 | OLA1 | 29789 | RNAseq | -0.4461 | 0.1646 | |
| SRP008496 | OLA1 | 29789 | RNAseq | -0.4715 | 0.0118 | |
| SRP064894 | OLA1 | 29789 | RNAseq | -0.1100 | 0.5456 | |
| SRP133303 | OLA1 | 29789 | RNAseq | 0.3420 | 0.0401 | |
| SRP159526 | OLA1 | 29789 | RNAseq | 0.1399 | 0.3161 | |
| SRP193095 | OLA1 | 29789 | RNAseq | -0.1607 | 0.2259 | |
| SRP219564 | OLA1 | 29789 | RNAseq | -0.3151 | 0.1828 | |
| TCGA | OLA1 | 29789 | RNAseq | 0.1804 | 0.0002 |
Upregulated datasets: 0; Downregulated datasets: 0.
Survival by OLA1 expression:
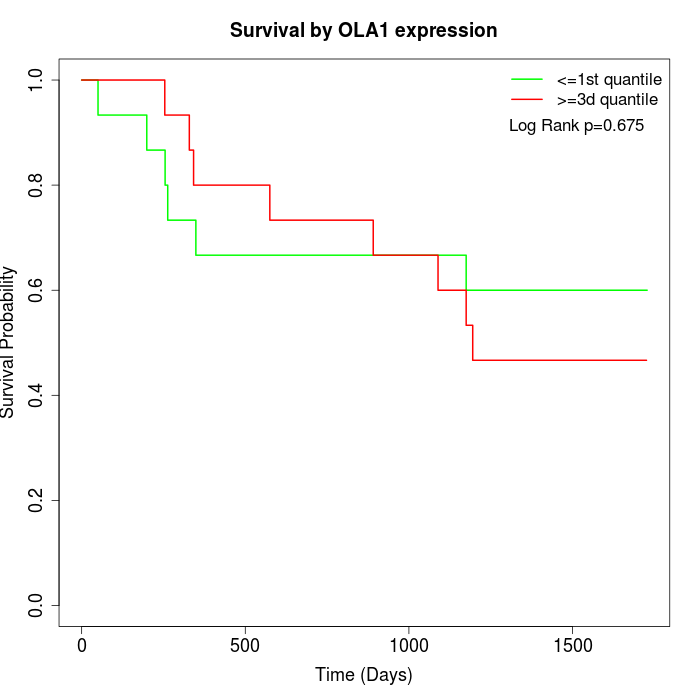 | 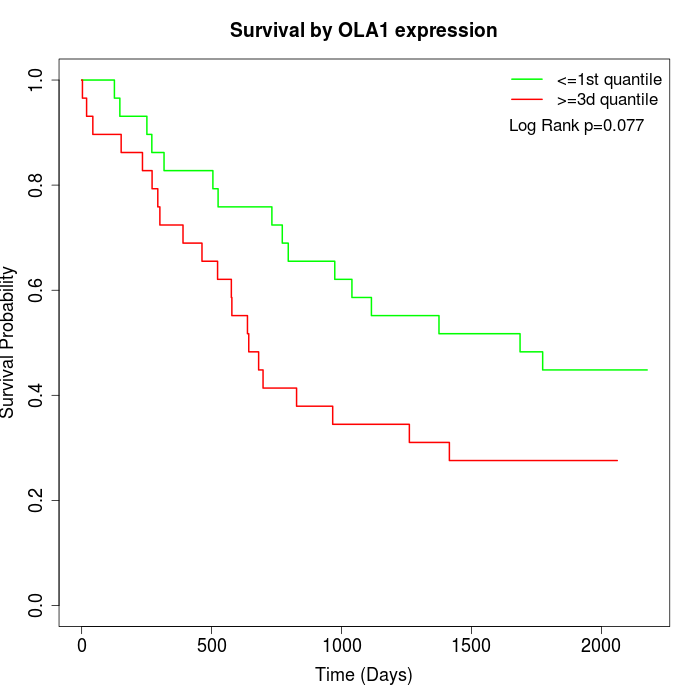 | 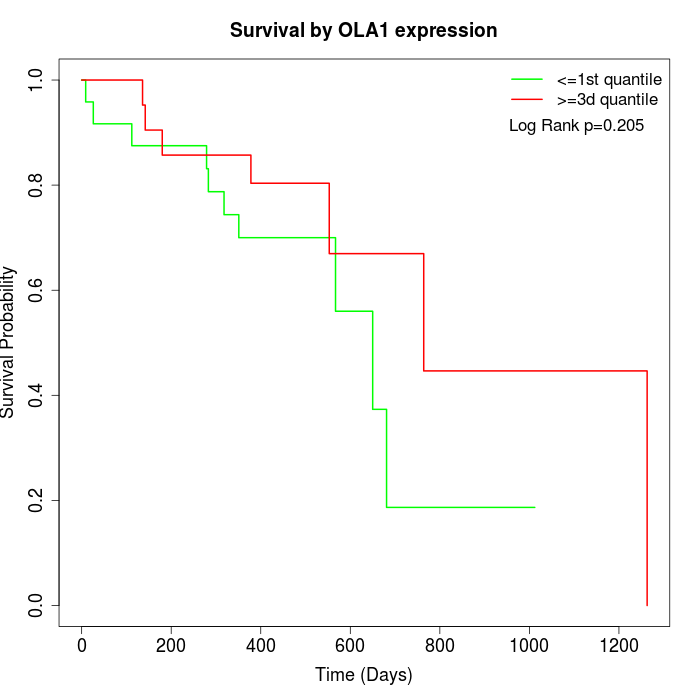 |
| GSE53622 | GSE53624 | TCGA |
Note: Click image to view full size file.
Copy number change of OLA1:
| Dataset | Gene | EntrezID | Gain | Loss | Normal | Detail |
|---|---|---|---|---|---|---|
| GSE15526 | OLA1 | 29789 | 10 | 0 | 20 | |
| GSE20123 | OLA1 | 29789 | 10 | 0 | 20 | |
| GSE43470 | OLA1 | 29789 | 6 | 1 | 36 | |
| GSE46452 | OLA1 | 29789 | 1 | 4 | 54 | |
| GSE47630 | OLA1 | 29789 | 5 | 3 | 32 | |
| GSE54993 | OLA1 | 29789 | 0 | 5 | 65 | |
| GSE54994 | OLA1 | 29789 | 12 | 3 | 38 | |
| GSE60625 | OLA1 | 29789 | 0 | 3 | 8 | |
| GSE74703 | OLA1 | 29789 | 5 | 1 | 30 | |
| GSE74704 | OLA1 | 29789 | 6 | 0 | 14 | |
| TCGA | OLA1 | 29789 | 30 | 5 | 61 |
Total number of gains: 85; Total number of losses: 25; Total Number of normals: 378.
Somatic mutations of OLA1:
Generating mutation plots.
Highly correlated genes for OLA1:
Showing top 20/1356 corelated genes with mean PCC>0.5.
| Gene1 | Gene2 | Mean PCC | Num. Datasets | Num. PCC<0 | Num. PCC>0.5 |
|---|---|---|---|---|---|
| OLA1 | ATP11C | 0.80932 | 3 | 0 | 3 |
| OLA1 | EXOC6 | 0.791375 | 3 | 0 | 3 |
| OLA1 | ANAPC4 | 0.780296 | 3 | 0 | 3 |
| OLA1 | NEK8 | 0.769863 | 3 | 0 | 3 |
| OLA1 | ROMO1 | 0.758424 | 3 | 0 | 3 |
| OLA1 | SLC36A4 | 0.747983 | 3 | 0 | 3 |
| OLA1 | PDPR | 0.742647 | 3 | 0 | 3 |
| OLA1 | ZNF680 | 0.738542 | 3 | 0 | 3 |
| OLA1 | SSB | 0.736745 | 12 | 0 | 11 |
| OLA1 | CDC42SE1 | 0.731338 | 3 | 0 | 3 |
| OLA1 | ZNF251 | 0.721133 | 3 | 0 | 3 |
| OLA1 | NOP58 | 0.717968 | 7 | 0 | 7 |
| OLA1 | HPS4 | 0.71736 | 3 | 0 | 3 |
| OLA1 | ZFP90 | 0.716667 | 3 | 0 | 3 |
| OLA1 | PSMD14 | 0.715549 | 12 | 0 | 11 |
| OLA1 | EBNA1BP2 | 0.715335 | 3 | 0 | 3 |
| OLA1 | CCS | 0.713768 | 3 | 0 | 3 |
| OLA1 | RNF217 | 0.71094 | 6 | 0 | 5 |
| OLA1 | INTS4 | 0.707028 | 3 | 0 | 3 |
| OLA1 | SMCR8 | 0.700069 | 4 | 0 | 3 |
For details and further investigation, click here