| Full name: opioid receptor mu 1 | Alias Symbol: MOR1 | ||
| Type: protein-coding gene | Cytoband: 6q25.2 | ||
| Entrez ID: 4988 | HGNC ID: HGNC:8156 | Ensembl Gene: ENSG00000112038 | OMIM ID: 600018 |
| Related drugs: ALFENTANIL, ALFENTANIL HYDROCHLORIDE, ALVIMOPAN, ANILERIDINE, ANILERIDINE HYDROCHLORIDE, ANILERIDINE PHOSPHATE, AXELOPRAN, AXOMADOL, BENZHYDROCODONE HYDROCHLORIDE, BEVENOPRAN... [more] | |||
OPRM1 involved pathways:
| KEGG pathway | Description | View |
|---|---|---|
| hsa04915 | Estrogen signaling pathway | |
| hsa05032 | Morphine addiction |
Expression of OPRM1:
| Dataset | Gene | EntrezID | Probe | Log2FC | Adj.pValue | Expression |
|---|---|---|---|---|---|---|
| GSE17351 | OPRM1 | 4988 | 211359_s_at | 0.2712 | 0.2557 | |
| GSE20347 | OPRM1 | 4988 | 211359_s_at | 0.0834 | 0.3632 | |
| GSE23400 | OPRM1 | 4988 | 211359_s_at | -0.0242 | 0.6650 | |
| GSE26886 | OPRM1 | 4988 | 211359_s_at | 0.0348 | 0.8153 | |
| GSE29001 | OPRM1 | 4988 | 211359_s_at | -0.0781 | 0.7097 | |
| GSE38129 | OPRM1 | 4988 | 211359_s_at | -0.0329 | 0.7951 | |
| GSE45670 | OPRM1 | 4988 | 211359_s_at | 0.1056 | 0.2871 | |
| GSE53622 | OPRM1 | 4988 | 141789 | -0.0819 | 0.7811 | |
| GSE53624 | OPRM1 | 4988 | 141789 | 0.1345 | 0.2179 | |
| GSE63941 | OPRM1 | 4988 | 211359_s_at | 0.1837 | 0.1921 | |
| GSE77861 | OPRM1 | 4988 | 211359_s_at | -0.0705 | 0.4827 | |
| GSE97050 | OPRM1 | 4988 | A_24_P397613 | -0.3548 | 0.4106 | |
| SRP007169 | OPRM1 | 4988 | RNAseq | 1.2655 | 0.1686 | |
| SRP064894 | OPRM1 | 4988 | RNAseq | 0.6027 | 0.0426 | |
| SRP133303 | OPRM1 | 4988 | RNAseq | -0.0779 | 0.6106 | |
| SRP159526 | OPRM1 | 4988 | RNAseq | 1.1187 | 0.0337 | |
| SRP193095 | OPRM1 | 4988 | RNAseq | -0.4621 | 0.0032 | |
| SRP219564 | OPRM1 | 4988 | RNAseq | -0.1690 | 0.7844 | |
| TCGA | OPRM1 | 4988 | RNAseq | -1.6033 | 0.3468 |
Upregulated datasets: 1; Downregulated datasets: 0.
Survival by OPRM1 expression:
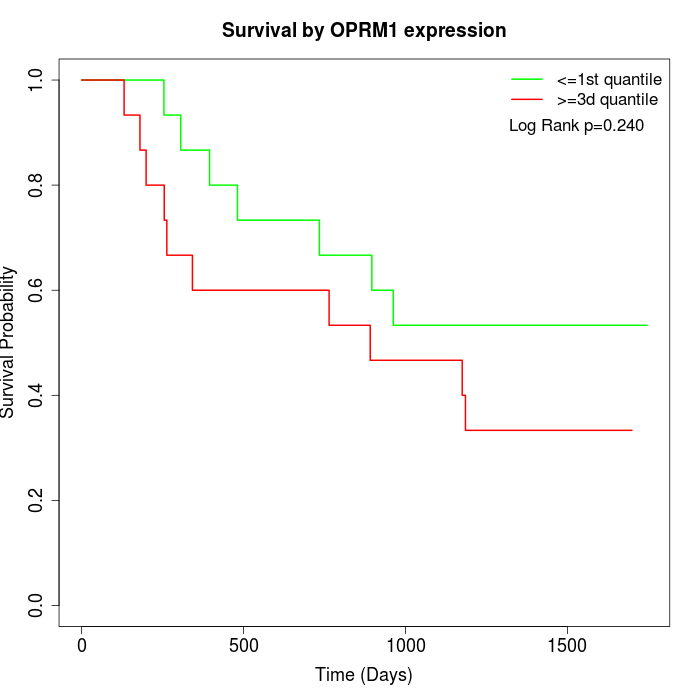 | 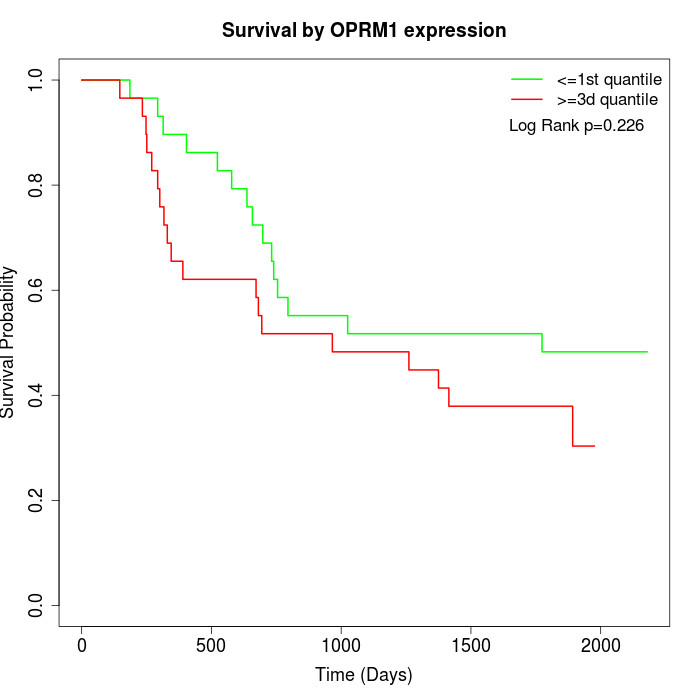 | 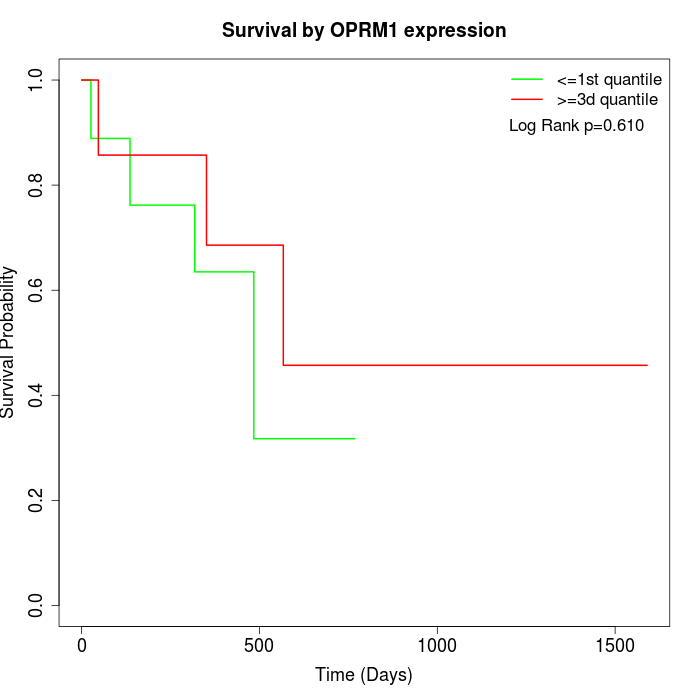 |
| GSE53622 | GSE53624 | TCGA |
Note: Click image to view full size file.
Copy number change of OPRM1:
| Dataset | Gene | EntrezID | Gain | Loss | Normal | Detail |
|---|---|---|---|---|---|---|
| GSE15526 | OPRM1 | 4988 | 1 | 4 | 25 | |
| GSE20123 | OPRM1 | 4988 | 1 | 3 | 26 | |
| GSE43470 | OPRM1 | 4988 | 4 | 0 | 39 | |
| GSE46452 | OPRM1 | 4988 | 3 | 10 | 46 | |
| GSE47630 | OPRM1 | 4988 | 9 | 4 | 27 | |
| GSE54993 | OPRM1 | 4988 | 3 | 2 | 65 | |
| GSE54994 | OPRM1 | 4988 | 8 | 8 | 37 | |
| GSE60625 | OPRM1 | 4988 | 0 | 1 | 10 | |
| GSE74703 | OPRM1 | 4988 | 4 | 0 | 32 | |
| GSE74704 | OPRM1 | 4988 | 0 | 1 | 19 | |
| TCGA | OPRM1 | 4988 | 12 | 21 | 63 |
Total number of gains: 45; Total number of losses: 54; Total Number of normals: 389.
Somatic mutations of OPRM1:
Generating mutation plots.
Highly correlated genes for OPRM1:
Showing top 20/536 corelated genes with mean PCC>0.5.
| Gene1 | Gene2 | Mean PCC | Num. Datasets | Num. PCC<0 | Num. PCC>0.5 |
|---|---|---|---|---|---|
| OPRM1 | CASQ1 | 0.751778 | 3 | 0 | 3 |
| OPRM1 | KRT38 | 0.732879 | 3 | 0 | 3 |
| OPRM1 | POU6F1 | 0.72705 | 3 | 0 | 3 |
| OPRM1 | PRLR | 0.724568 | 3 | 0 | 3 |
| OPRM1 | GML | 0.701208 | 6 | 0 | 6 |
| OPRM1 | NTNG1 | 0.699189 | 4 | 0 | 4 |
| OPRM1 | TEX15 | 0.698969 | 4 | 0 | 4 |
| OPRM1 | HOXA3 | 0.697737 | 3 | 0 | 3 |
| OPRM1 | ART4 | 0.695228 | 5 | 0 | 5 |
| OPRM1 | SERPINA5 | 0.693905 | 3 | 0 | 3 |
| OPRM1 | CHST5 | 0.683896 | 4 | 0 | 4 |
| OPRM1 | CA7 | 0.683254 | 5 | 0 | 5 |
| OPRM1 | RPS6KA6 | 0.681963 | 5 | 0 | 4 |
| OPRM1 | ENOX1 | 0.678248 | 3 | 0 | 3 |
| OPRM1 | PCSK6 | 0.676418 | 3 | 0 | 3 |
| OPRM1 | OR10J1 | 0.675197 | 3 | 0 | 3 |
| OPRM1 | CCL25 | 0.669336 | 6 | 0 | 6 |
| OPRM1 | SIX6 | 0.664834 | 3 | 0 | 3 |
| OPRM1 | BCAN | 0.663625 | 5 | 0 | 4 |
| OPRM1 | TECTA | 0.662492 | 3 | 0 | 3 |
For details and further investigation, click here