| Full name: OTU deubiquitinase, ubiquitin aldehyde binding 2 | Alias Symbol: FLJ21916|MGC3102 | ||
| Type: protein-coding gene | Cytoband: 14q32.12 | ||
| Entrez ID: 78990 | HGNC ID: HGNC:20351 | Ensembl Gene: ENSG00000089723 | OMIM ID: 608338 |
Expression of OTUB2:
| Dataset | Gene | EntrezID | Probe | Log2FC | Adj.pValue | Expression |
|---|---|---|---|---|---|---|
| GSE17351 | OTUB2 | 78990 | 219369_s_at | 0.1909 | 0.8068 | |
| GSE20347 | OTUB2 | 78990 | 219369_s_at | -0.4770 | 0.0113 | |
| GSE23400 | OTUB2 | 78990 | 219369_s_at | -0.2256 | 0.0001 | |
| GSE26886 | OTUB2 | 78990 | 219369_s_at | -1.4888 | 0.0000 | |
| GSE29001 | OTUB2 | 78990 | 219369_s_at | -0.5152 | 0.0316 | |
| GSE38129 | OTUB2 | 78990 | 219369_s_at | -0.2023 | 0.3161 | |
| GSE45670 | OTUB2 | 78990 | 219369_s_at | 0.2929 | 0.2239 | |
| GSE53622 | OTUB2 | 78990 | 41002 | -0.1786 | 0.1286 | |
| GSE53624 | OTUB2 | 78990 | 41002 | -0.4422 | 0.0000 | |
| GSE63941 | OTUB2 | 78990 | 219369_s_at | 1.3131 | 0.0955 | |
| GSE77861 | OTUB2 | 78990 | 219369_s_at | -0.3512 | 0.1355 | |
| GSE97050 | OTUB2 | 78990 | A_23_P65386 | 0.1976 | 0.5834 | |
| SRP007169 | OTUB2 | 78990 | RNAseq | -2.2824 | 0.0000 | |
| SRP008496 | OTUB2 | 78990 | RNAseq | -2.0029 | 0.0000 | |
| SRP064894 | OTUB2 | 78990 | RNAseq | -0.7911 | 0.0194 | |
| SRP133303 | OTUB2 | 78990 | RNAseq | -0.7616 | 0.0093 | |
| SRP159526 | OTUB2 | 78990 | RNAseq | -0.8549 | 0.0421 | |
| SRP193095 | OTUB2 | 78990 | RNAseq | -0.3857 | 0.0333 | |
| SRP219564 | OTUB2 | 78990 | RNAseq | -0.7115 | 0.4055 | |
| TCGA | OTUB2 | 78990 | RNAseq | 0.2377 | 0.1448 |
Upregulated datasets: 0; Downregulated datasets: 3.
Survival by OTUB2 expression:
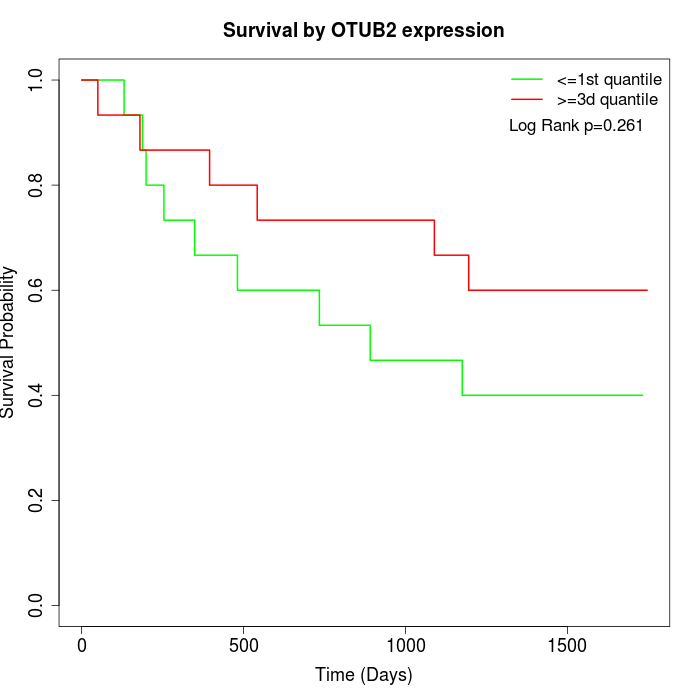 | 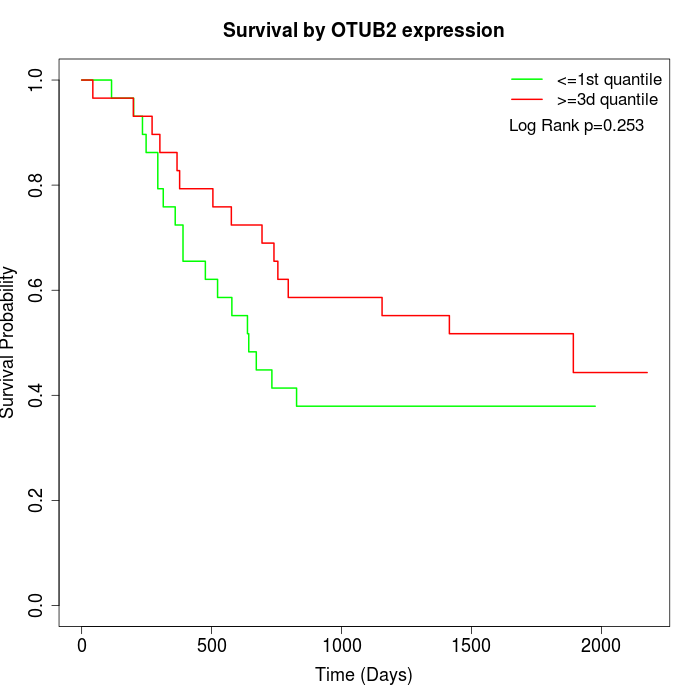 | 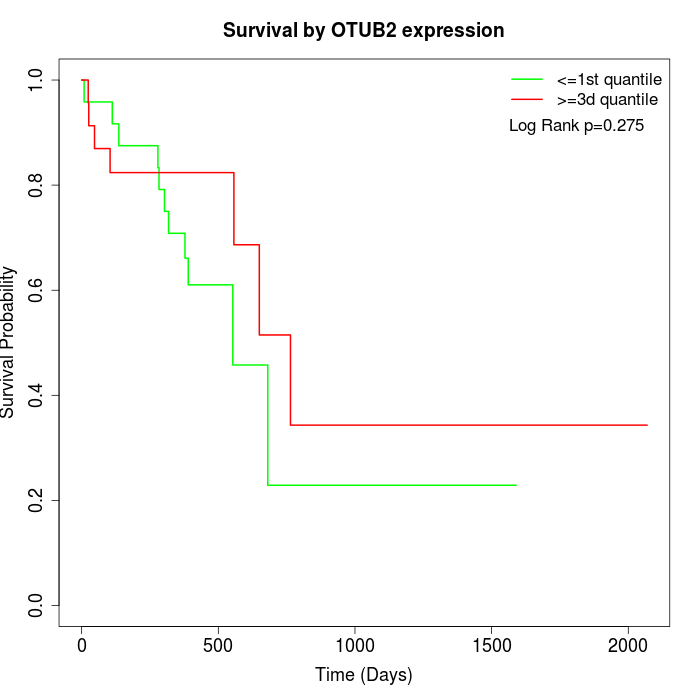 |
| GSE53622 | GSE53624 | TCGA |
Note: Click image to view full size file.
Copy number change of OTUB2:
| Dataset | Gene | EntrezID | Gain | Loss | Normal | Detail |
|---|---|---|---|---|---|---|
| GSE15526 | OTUB2 | 78990 | 8 | 4 | 18 | |
| GSE20123 | OTUB2 | 78990 | 8 | 3 | 19 | |
| GSE43470 | OTUB2 | 78990 | 7 | 3 | 33 | |
| GSE46452 | OTUB2 | 78990 | 16 | 3 | 40 | |
| GSE47630 | OTUB2 | 78990 | 11 | 8 | 21 | |
| GSE54993 | OTUB2 | 78990 | 3 | 8 | 59 | |
| GSE54994 | OTUB2 | 78990 | 20 | 4 | 29 | |
| GSE60625 | OTUB2 | 78990 | 0 | 2 | 9 | |
| GSE74703 | OTUB2 | 78990 | 6 | 3 | 27 | |
| GSE74704 | OTUB2 | 78990 | 4 | 3 | 13 | |
| TCGA | OTUB2 | 78990 | 30 | 20 | 46 |
Total number of gains: 113; Total number of losses: 61; Total Number of normals: 314.
Somatic mutations of OTUB2:
Generating mutation plots.
Highly correlated genes for OTUB2:
Showing top 20/432 corelated genes with mean PCC>0.5.
| Gene1 | Gene2 | Mean PCC | Num. Datasets | Num. PCC<0 | Num. PCC>0.5 |
|---|---|---|---|---|---|
| OTUB2 | ZNRF2 | 0.703597 | 3 | 0 | 3 |
| OTUB2 | TET3 | 0.688152 | 3 | 0 | 3 |
| OTUB2 | ERN1 | 0.684231 | 4 | 0 | 3 |
| OTUB2 | LARP4B | 0.677816 | 4 | 0 | 4 |
| OTUB2 | CLEC18C | 0.673402 | 3 | 0 | 3 |
| OTUB2 | ARL11 | 0.67226 | 3 | 0 | 3 |
| OTUB2 | CYTH1 | 0.670788 | 5 | 0 | 4 |
| OTUB2 | ZNF770 | 0.668396 | 4 | 0 | 4 |
| OTUB2 | HECTD1 | 0.668077 | 4 | 0 | 3 |
| OTUB2 | NOBOX | 0.666828 | 3 | 0 | 3 |
| OTUB2 | LAMTOR2 | 0.660634 | 3 | 0 | 3 |
| OTUB2 | DCD | 0.659423 | 4 | 0 | 3 |
| OTUB2 | RNF222 | 0.657853 | 3 | 0 | 3 |
| OTUB2 | IL1F10 | 0.657604 | 3 | 0 | 3 |
| OTUB2 | ADAMTS17 | 0.655238 | 3 | 0 | 3 |
| OTUB2 | SNX16 | 0.647142 | 6 | 0 | 5 |
| OTUB2 | LDHAL6A | 0.643271 | 3 | 0 | 3 |
| OTUB2 | FBXO34 | 0.637423 | 8 | 0 | 6 |
| OTUB2 | SLC25A51 | 0.633479 | 3 | 0 | 3 |
| OTUB2 | PTBP3 | 0.633166 | 5 | 0 | 4 |
For details and further investigation, click here