| Full name: fucosyltransferase 1 (H blood group) | Alias Symbol: | ||
| Type: protein-coding gene | Cytoband: 19q13.33 | ||
| Entrez ID: 2523 | HGNC ID: HGNC:4012 | Ensembl Gene: ENSG00000174951 | OMIM ID: 211100 |
Screen Evidence:
| |||
Expression of FUT1:
| Dataset | Gene | EntrezID | Probe | Log2FC | Adj.pValue | Expression |
|---|---|---|---|---|---|---|
| GSE17351 | FUT1 | 2523 | 206109_at | 0.7257 | 0.0471 | |
| GSE20347 | FUT1 | 2523 | 206109_at | 0.3273 | 0.0183 | |
| GSE23400 | FUT1 | 2523 | 206109_at | 0.1027 | 0.0805 | |
| GSE26886 | FUT1 | 2523 | 206109_at | -0.0136 | 0.9666 | |
| GSE29001 | FUT1 | 2523 | 206109_at | 0.4758 | 0.0886 | |
| GSE38129 | FUT1 | 2523 | 206109_at | 0.4399 | 0.0048 | |
| GSE45670 | FUT1 | 2523 | 206109_at | 0.6581 | 0.0007 | |
| GSE53622 | FUT1 | 2523 | 115897 | -0.0439 | 0.7487 | |
| GSE53624 | FUT1 | 2523 | 16915 | 0.1775 | 0.0444 | |
| GSE63941 | FUT1 | 2523 | 206109_at | 2.0282 | 0.0036 | |
| GSE77861 | FUT1 | 2523 | 206109_at | 0.5027 | 0.0055 | |
| GSE97050 | FUT1 | 2523 | A_23_P107963 | 0.1350 | 0.5776 | |
| SRP007169 | FUT1 | 2523 | RNAseq | 1.1175 | 0.0132 | |
| SRP008496 | FUT1 | 2523 | RNAseq | 0.6318 | 0.0785 | |
| SRP064894 | FUT1 | 2523 | RNAseq | 1.0577 | 0.0000 | |
| SRP133303 | FUT1 | 2523 | RNAseq | 0.3226 | 0.1399 | |
| SRP159526 | FUT1 | 2523 | RNAseq | 0.4519 | 0.3116 | |
| SRP193095 | FUT1 | 2523 | RNAseq | 0.4009 | 0.0013 | |
| SRP219564 | FUT1 | 2523 | RNAseq | -0.1599 | 0.7313 | |
| TCGA | FUT1 | 2523 | RNAseq | -0.3043 | 0.0033 |
Upregulated datasets: 3; Downregulated datasets: 0.
Survival by FUT1 expression:
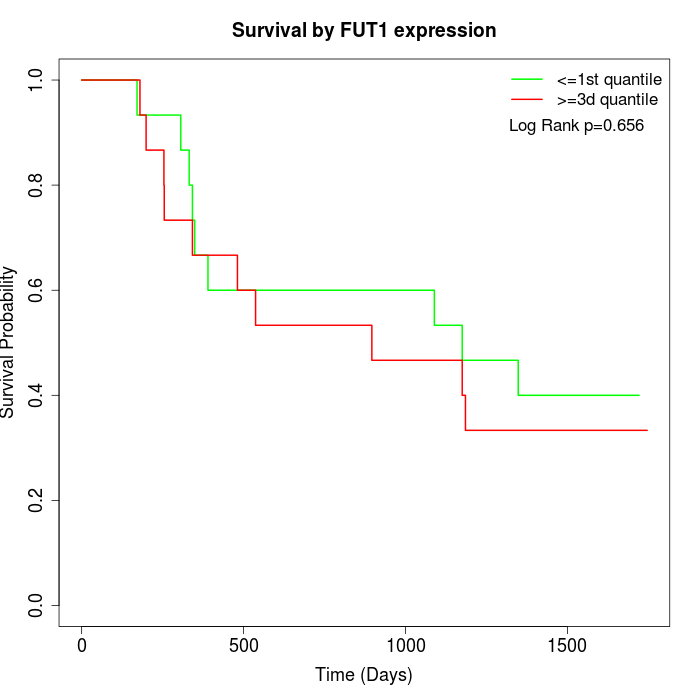 | 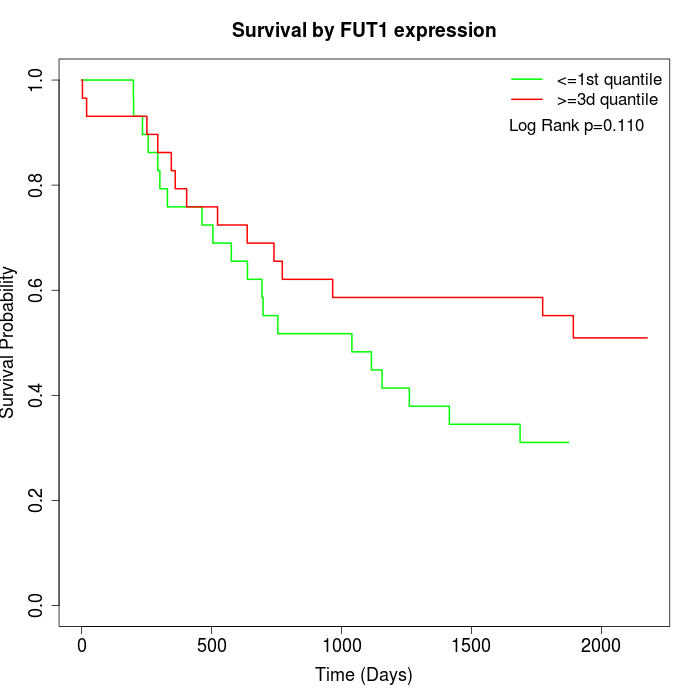 | 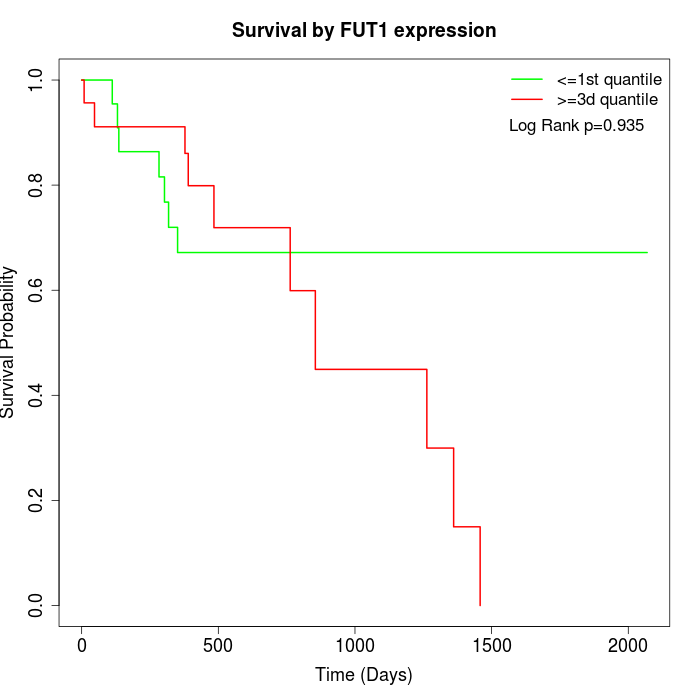 |
| GSE53622 | GSE53624 | TCGA |
Note: Click image to view full size file.
Copy number change of FUT1:
| Dataset | Gene | EntrezID | Gain | Loss | Normal | Detail |
|---|---|---|---|---|---|---|
| GSE15526 | FUT1 | 2523 | 4 | 4 | 22 | |
| GSE20123 | FUT1 | 2523 | 4 | 3 | 23 | |
| GSE43470 | FUT1 | 2523 | 4 | 10 | 29 | |
| GSE46452 | FUT1 | 2523 | 45 | 1 | 13 | |
| GSE47630 | FUT1 | 2523 | 9 | 6 | 25 | |
| GSE54993 | FUT1 | 2523 | 17 | 4 | 49 | |
| GSE54994 | FUT1 | 2523 | 4 | 14 | 35 | |
| GSE60625 | FUT1 | 2523 | 9 | 0 | 2 | |
| GSE74703 | FUT1 | 2523 | 4 | 7 | 25 | |
| GSE74704 | FUT1 | 2523 | 4 | 1 | 15 | |
| TCGA | FUT1 | 2523 | 14 | 18 | 64 |
Total number of gains: 118; Total number of losses: 68; Total Number of normals: 302.
Somatic mutations of FUT1:
Generating mutation plots.
Highly correlated genes for FUT1:
Showing top 20/404 corelated genes with mean PCC>0.5.
| Gene1 | Gene2 | Mean PCC | Num. Datasets | Num. PCC<0 | Num. PCC>0.5 |
|---|---|---|---|---|---|
| FUT1 | C19orf25 | 0.750406 | 3 | 0 | 3 |
| FUT1 | RHBDD3 | 0.749295 | 4 | 0 | 4 |
| FUT1 | TTPAL | 0.73534 | 4 | 0 | 3 |
| FUT1 | BAX | 0.73435 | 4 | 0 | 4 |
| FUT1 | UHRF1 | 0.730267 | 3 | 0 | 3 |
| FUT1 | NTMT1 | 0.727035 | 3 | 0 | 3 |
| FUT1 | COL27A1 | 0.7234 | 3 | 0 | 3 |
| FUT1 | TMEM9 | 0.719999 | 4 | 0 | 3 |
| FUT1 | BEND3 | 0.719873 | 5 | 0 | 4 |
| FUT1 | COA6 | 0.71874 | 4 | 0 | 4 |
| FUT1 | HAUS8 | 0.714647 | 4 | 0 | 3 |
| FUT1 | PARS2 | 0.713513 | 3 | 0 | 3 |
| FUT1 | SIM1 | 0.713316 | 3 | 0 | 3 |
| FUT1 | ZNF593 | 0.701683 | 3 | 0 | 3 |
| FUT1 | LRSAM1 | 0.701615 | 3 | 0 | 3 |
| FUT1 | CCDC142 | 0.6994 | 3 | 0 | 3 |
| FUT1 | SLC18A3 | 0.698883 | 3 | 0 | 3 |
| FUT1 | TRIM11 | 0.698843 | 5 | 0 | 4 |
| FUT1 | MBD6 | 0.698565 | 3 | 0 | 3 |
| FUT1 | PTAFR | 0.695168 | 3 | 0 | 3 |
For details and further investigation, click here