| Full name: prostate cancer associated transcript 6 | Alias Symbol: ncRNA-a2|PCAN-R1|KDM5BAS1|onco-lncRNA-96 | ||
| Type: non-coding RNA | Cytoband: 1q32.1 | ||
| Entrez ID: 100506696 | HGNC ID: HGNC:43714 | Ensembl Gene: ENSG00000228288 | OMIM ID: |
Expression of PCAT6:
| Dataset | Gene | EntrezID | Probe | Log2FC | Adj.pValue | Expression |
|---|---|---|---|---|---|---|
| GSE17351 | PCAT6 | 100506696 | 231233_at | 0.3243 | 0.7188 | |
| GSE26886 | PCAT6 | 100506696 | 231233_at | -0.2097 | 0.4795 | |
| GSE45670 | PCAT6 | 100506696 | 231233_at | 0.2242 | 0.4173 | |
| GSE53622 | PCAT6 | 100506696 | 151796 | 0.1183 | 0.5880 | |
| GSE53624 | PCAT6 | 100506696 | 144909 | -0.1688 | 0.1700 | |
| GSE63941 | PCAT6 | 100506696 | 231233_at | -0.2341 | 0.7588 | |
| GSE77861 | PCAT6 | 100506696 | 231233_at | -0.0883 | 0.7948 | |
| SRP064894 | PCAT6 | 100506696 | RNAseq | -0.0893 | 0.7318 | |
| SRP133303 | PCAT6 | 100506696 | RNAseq | -0.1231 | 0.6854 | |
| SRP159526 | PCAT6 | 100506696 | RNAseq | 0.9685 | 0.0706 | |
| SRP219564 | PCAT6 | 100506696 | RNAseq | 0.0376 | 0.9491 |
Upregulated datasets: 0; Downregulated datasets: 0.
Survival by PCAT6 expression:
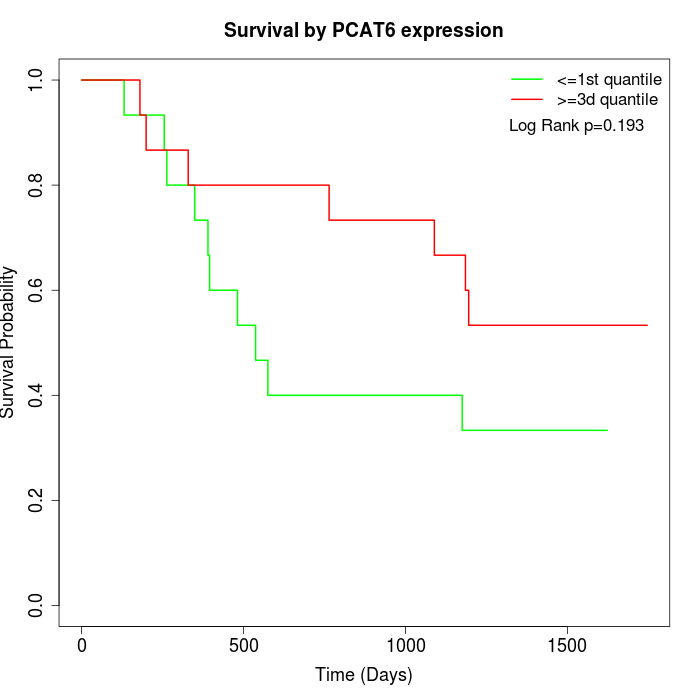 | 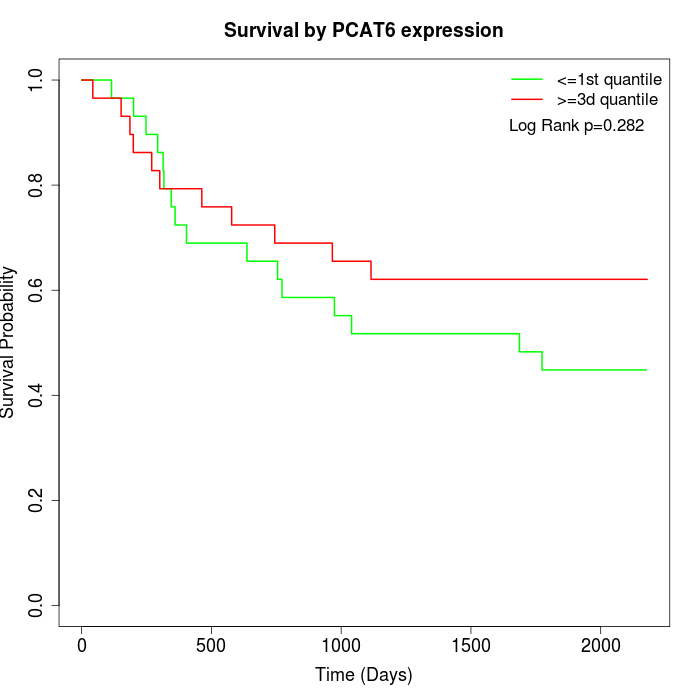 |
| GSE53622 | GSE53624 |
Note: Click image to view full size file.
Copy number change of PCAT6:
| Dataset | Gene | EntrezID | Gain | Loss | Normal | Detail |
|---|---|---|---|---|---|---|
| GSE15526 | PCAT6 | 100506696 | 11 | 0 | 19 | |
| GSE20123 | PCAT6 | 100506696 | 11 | 0 | 19 | |
| GSE43470 | PCAT6 | 100506696 | 6 | 0 | 37 | |
| GSE46452 | PCAT6 | 100506696 | 3 | 1 | 55 | |
| GSE47630 | PCAT6 | 100506696 | 14 | 0 | 26 | |
| GSE54993 | PCAT6 | 100506696 | 0 | 6 | 64 | |
| GSE54994 | PCAT6 | 100506696 | 15 | 0 | 38 | |
| GSE60625 | PCAT6 | 100506696 | 0 | 0 | 11 | |
| GSE74703 | PCAT6 | 100506696 | 6 | 0 | 30 | |
| GSE74704 | PCAT6 | 100506696 | 5 | 0 | 15 | |
| TCGA | PCAT6 | 100506696 | 43 | 4 | 49 |
Total number of gains: 114; Total number of losses: 11; Total Number of normals: 363.
Somatic mutations of PCAT6:
Generating mutation plots.
Highly correlated genes for PCAT6:
Showing top 20/31 corelated genes with mean PCC>0.5.
| Gene1 | Gene2 | Mean PCC | Num. Datasets | Num. PCC<0 | Num. PCC>0.5 |
|---|---|---|---|---|---|
| PCAT6 | AACS | 0.644347 | 3 | 0 | 3 |
| PCAT6 | FKBPL | 0.639191 | 3 | 0 | 3 |
| PCAT6 | YWHAZ | 0.61832 | 4 | 0 | 3 |
| PCAT6 | SFMBT1 | 0.617854 | 3 | 0 | 3 |
| PCAT6 | RBM8A | 0.596333 | 4 | 0 | 3 |
| PCAT6 | MAP7 | 0.594767 | 4 | 0 | 3 |
| PCAT6 | MVB12A | 0.586556 | 4 | 0 | 3 |
| PCAT6 | GORASP2 | 0.575431 | 4 | 0 | 3 |
| PCAT6 | CAPG | 0.57476 | 3 | 0 | 3 |
| PCAT6 | SCAMP4 | 0.567055 | 4 | 0 | 3 |
| PCAT6 | BAIAP2L1 | 0.563542 | 4 | 0 | 3 |
| PCAT6 | MINK1 | 0.559862 | 5 | 0 | 3 |
| PCAT6 | CAMSAP3 | 0.558627 | 4 | 0 | 3 |
| PCAT6 | F12 | 0.557558 | 5 | 0 | 3 |
| PCAT6 | ZNF385A | 0.556234 | 5 | 0 | 3 |
| PCAT6 | KDM5B | 0.555676 | 5 | 0 | 3 |
| PCAT6 | DCAF5 | 0.555215 | 4 | 0 | 3 |
| PCAT6 | TMPRSS13 | 0.553879 | 4 | 0 | 3 |
| PCAT6 | AMMECR1 | 0.551725 | 5 | 0 | 3 |
| PCAT6 | EFNA3 | 0.540033 | 5 | 0 | 3 |
For details and further investigation, click here