| Full name: cathepsin E | Alias Symbol: | ||
| Type: protein-coding gene | Cytoband: 1q32.1 | ||
| Entrez ID: 1510 | HGNC ID: HGNC:2530 | Ensembl Gene: ENSG00000196188 | OMIM ID: 116890 |
| Related drugs: CHEMBL313773, GRASSYSTATIN A, NAFCILLIN... [more] | |||
Expression of CTSE:
| Dataset | Gene | EntrezID | Probe | Log2FC | Adj.pValue | Expression |
|---|---|---|---|---|---|---|
| GSE17351 | CTSE | 1510 | 205927_s_at | -0.1041 | 0.5898 | |
| GSE20347 | CTSE | 1510 | 205927_s_at | -0.0106 | 0.9364 | |
| GSE23400 | CTSE | 1510 | 205927_s_at | -0.1902 | 0.0454 | |
| GSE26886 | CTSE | 1510 | 205927_s_at | 0.3378 | 0.3011 | |
| GSE29001 | CTSE | 1510 | 205927_s_at | 0.1524 | 0.4757 | |
| GSE38129 | CTSE | 1510 | 205927_s_at | -0.5205 | 0.1242 | |
| GSE45670 | CTSE | 1510 | 205927_s_at | 0.1131 | 0.2966 | |
| GSE53622 | CTSE | 1510 | 28675 | -0.2029 | 0.2579 | |
| GSE53624 | CTSE | 1510 | 28675 | -0.4220 | 0.0060 | |
| GSE63941 | CTSE | 1510 | 205927_s_at | -0.0619 | 0.7288 | |
| GSE77861 | CTSE | 1510 | 205927_s_at | -0.0917 | 0.3597 | |
| GSE97050 | CTSE | 1510 | A_23_P10291 | -0.0226 | 0.9314 | |
| TCGA | CTSE | 1510 | RNAseq | -3.7515 | 0.0000 |
Upregulated datasets: 0; Downregulated datasets: 1.
Survival by CTSE expression:
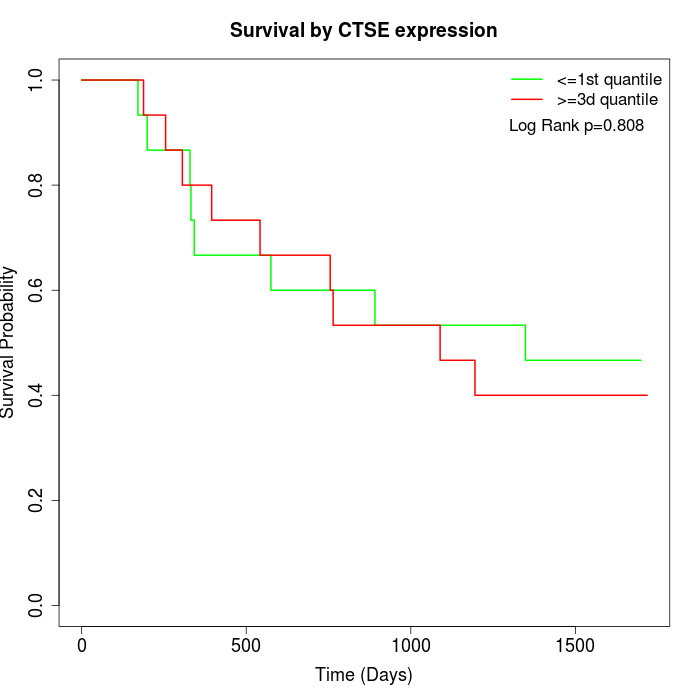 | 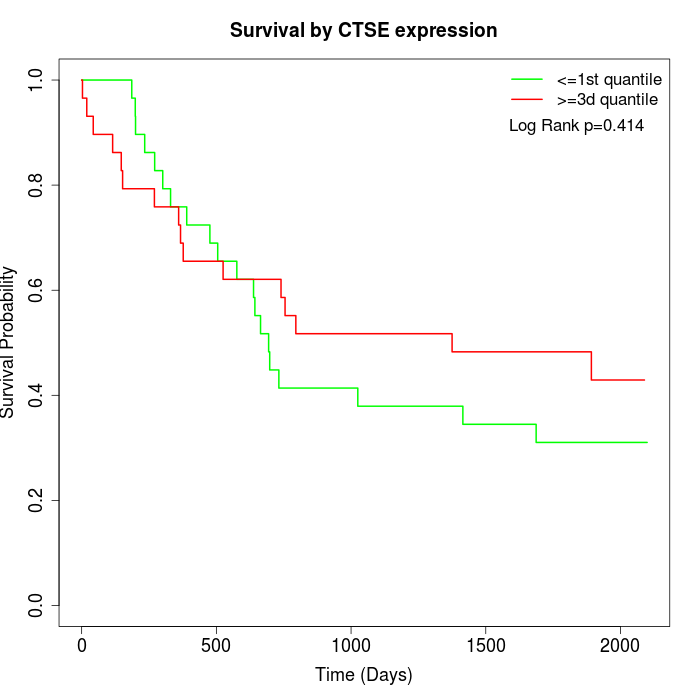 | 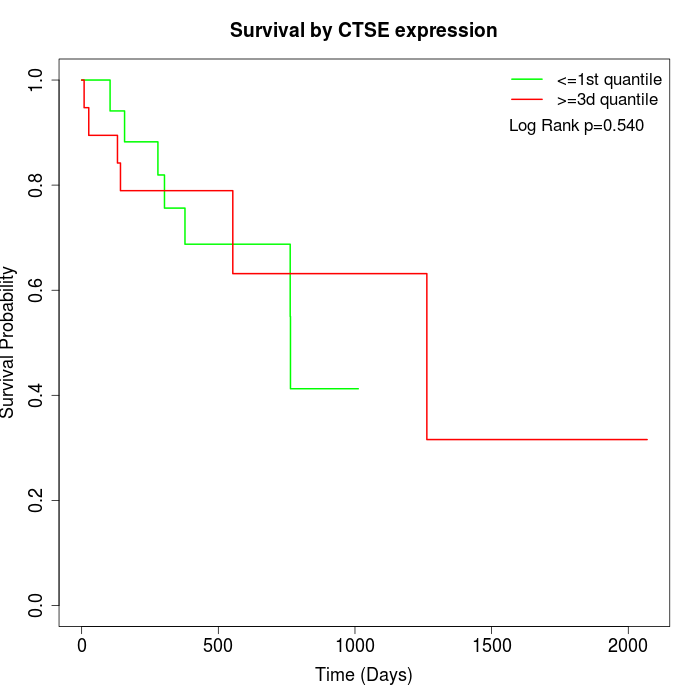 |
| GSE53622 | GSE53624 | TCGA |
Note: Click image to view full size file.
Copy number change of CTSE:
| Dataset | Gene | EntrezID | Gain | Loss | Normal | Detail |
|---|---|---|---|---|---|---|
| GSE15526 | CTSE | 1510 | 11 | 0 | 19 | |
| GSE20123 | CTSE | 1510 | 11 | 0 | 19 | |
| GSE43470 | CTSE | 1510 | 7 | 0 | 36 | |
| GSE46452 | CTSE | 1510 | 3 | 1 | 55 | |
| GSE47630 | CTSE | 1510 | 14 | 0 | 26 | |
| GSE54993 | CTSE | 1510 | 0 | 6 | 64 | |
| GSE54994 | CTSE | 1510 | 14 | 0 | 39 | |
| GSE60625 | CTSE | 1510 | 0 | 0 | 11 | |
| GSE74703 | CTSE | 1510 | 7 | 0 | 29 | |
| GSE74704 | CTSE | 1510 | 5 | 0 | 15 | |
| TCGA | CTSE | 1510 | 44 | 5 | 47 |
Total number of gains: 116; Total number of losses: 12; Total Number of normals: 360.
Somatic mutations of CTSE:
Generating mutation plots.
Highly correlated genes for CTSE:
Showing top 20/393 corelated genes with mean PCC>0.5.
| Gene1 | Gene2 | Mean PCC | Num. Datasets | Num. PCC<0 | Num. PCC>0.5 |
|---|---|---|---|---|---|
| CTSE | PHGR1 | 0.892731 | 3 | 0 | 3 |
| CTSE | LELP1 | 0.826027 | 3 | 0 | 3 |
| CTSE | SLC22A8 | 0.789776 | 3 | 0 | 3 |
| CTSE | SKAP1 | 0.770862 | 3 | 0 | 3 |
| CTSE | CATSPER3 | 0.767779 | 3 | 0 | 3 |
| CTSE | OTOP2 | 0.76724 | 3 | 0 | 3 |
| CTSE | LCN8 | 0.766146 | 3 | 0 | 3 |
| CTSE | UGT2B11 | 0.765513 | 3 | 0 | 3 |
| CTSE | CRB2 | 0.764771 | 3 | 0 | 3 |
| CTSE | SHANK1 | 0.761624 | 3 | 0 | 3 |
| CTSE | HBM | 0.758969 | 3 | 0 | 3 |
| CTSE | LACRT | 0.756934 | 3 | 0 | 3 |
| CTSE | OR1J4 | 0.752883 | 3 | 0 | 3 |
| CTSE | ATP4A | 0.752337 | 8 | 0 | 8 |
| CTSE | KCNT1 | 0.745341 | 3 | 0 | 3 |
| CTSE | ANKRD33 | 0.743418 | 3 | 0 | 3 |
| CTSE | PRSS54 | 0.742657 | 3 | 0 | 3 |
| CTSE | ATP2B2 | 0.735204 | 3 | 0 | 3 |
| CTSE | GALK1 | 0.733908 | 3 | 0 | 3 |
| CTSE | RELB | 0.730809 | 3 | 0 | 3 |
For details and further investigation, click here