| Full name: target of myb1 like 1 membrane trafficking protein | Alias Symbol: SRCASM | ||
| Type: protein-coding gene | Cytoband: 17q23.2 | ||
| Entrez ID: 10040 | HGNC ID: HGNC:11983 | Ensembl Gene: ENSG00000141198 | OMIM ID: 604701 |
Expression of TOM1L1:
| Dataset | Gene | EntrezID | Probe | Log2FC | Adj.pValue | Expression |
|---|---|---|---|---|---|---|
| GSE17351 | TOM1L1 | 10040 | 204485_s_at | -0.6185 | 0.1866 | |
| GSE20347 | TOM1L1 | 10040 | 204485_s_at | -0.4460 | 0.0754 | |
| GSE23400 | TOM1L1 | 10040 | 204485_s_at | 0.0514 | 0.5903 | |
| GSE26886 | TOM1L1 | 10040 | 204485_s_at | 0.2189 | 0.4285 | |
| GSE29001 | TOM1L1 | 10040 | 204485_s_at | -0.2953 | 0.6414 | |
| GSE38129 | TOM1L1 | 10040 | 204485_s_at | -0.0503 | 0.8499 | |
| GSE45670 | TOM1L1 | 10040 | 204485_s_at | -0.2975 | 0.1099 | |
| GSE53622 | TOM1L1 | 10040 | 76199 | -0.2332 | 0.0232 | |
| GSE53624 | TOM1L1 | 10040 | 76199 | -0.0803 | 0.2967 | |
| GSE63941 | TOM1L1 | 10040 | 204485_s_at | 2.1864 | 0.0009 | |
| GSE77861 | TOM1L1 | 10040 | 204485_s_at | -0.3870 | 0.1044 | |
| GSE97050 | TOM1L1 | 10040 | A_23_P118493 | -0.2221 | 0.5250 | |
| SRP007169 | TOM1L1 | 10040 | RNAseq | -0.3566 | 0.3425 | |
| SRP008496 | TOM1L1 | 10040 | RNAseq | -0.5771 | 0.0247 | |
| SRP064894 | TOM1L1 | 10040 | RNAseq | -0.8691 | 0.0051 | |
| SRP133303 | TOM1L1 | 10040 | RNAseq | 0.2396 | 0.4943 | |
| SRP159526 | TOM1L1 | 10040 | RNAseq | -0.1327 | 0.5542 | |
| SRP193095 | TOM1L1 | 10040 | RNAseq | -0.8954 | 0.0000 | |
| SRP219564 | TOM1L1 | 10040 | RNAseq | -0.6809 | 0.0895 | |
| TCGA | TOM1L1 | 10040 | RNAseq | -0.2176 | 0.0013 |
Upregulated datasets: 1; Downregulated datasets: 0.
Survival by TOM1L1 expression:
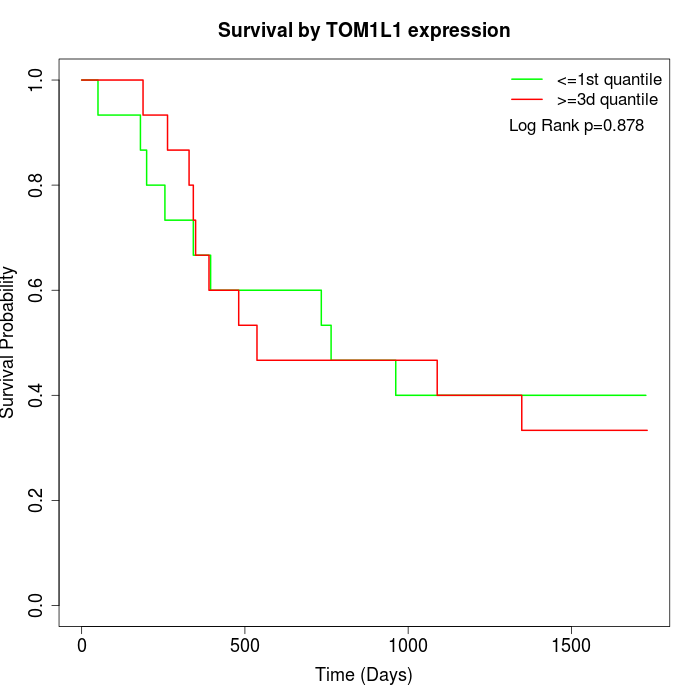 | 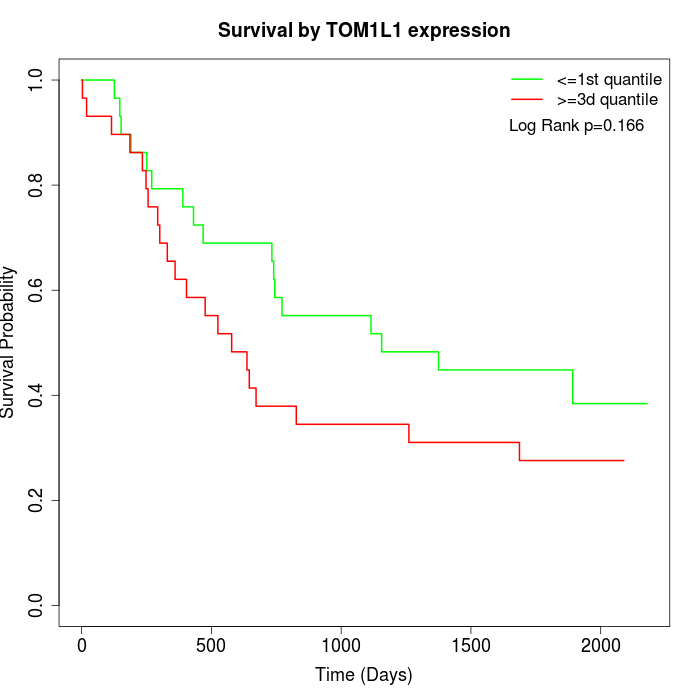 | 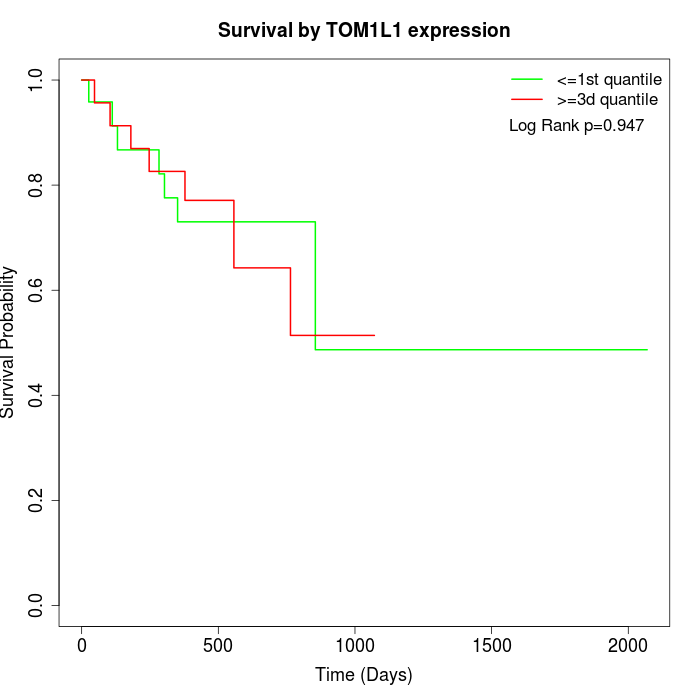 |
| GSE53622 | GSE53624 | TCGA |
Note: Click image to view full size file.
Copy number change of TOM1L1:
| Dataset | Gene | EntrezID | Gain | Loss | Normal | Detail |
|---|---|---|---|---|---|---|
| GSE15526 | TOM1L1 | 10040 | 4 | 1 | 25 | |
| GSE20123 | TOM1L1 | 10040 | 4 | 1 | 25 | |
| GSE43470 | TOM1L1 | 10040 | 2 | 1 | 40 | |
| GSE46452 | TOM1L1 | 10040 | 32 | 0 | 27 | |
| GSE47630 | TOM1L1 | 10040 | 7 | 1 | 32 | |
| GSE54993 | TOM1L1 | 10040 | 2 | 4 | 64 | |
| GSE54994 | TOM1L1 | 10040 | 9 | 5 | 39 | |
| GSE60625 | TOM1L1 | 10040 | 4 | 0 | 7 | |
| GSE74703 | TOM1L1 | 10040 | 2 | 1 | 33 | |
| GSE74704 | TOM1L1 | 10040 | 3 | 1 | 16 | |
| TCGA | TOM1L1 | 10040 | 27 | 7 | 62 |
Total number of gains: 96; Total number of losses: 22; Total Number of normals: 370.
Somatic mutations of TOM1L1:
Generating mutation plots.
Highly correlated genes for TOM1L1:
Showing top 20/451 corelated genes with mean PCC>0.5.
| Gene1 | Gene2 | Mean PCC | Num. Datasets | Num. PCC<0 | Num. PCC>0.5 |
|---|---|---|---|---|---|
| TOM1L1 | TJP1 | 0.792375 | 3 | 0 | 3 |
| TOM1L1 | PTGR1 | 0.791847 | 3 | 0 | 3 |
| TOM1L1 | YAF2 | 0.784191 | 3 | 0 | 3 |
| TOM1L1 | RPUSD3 | 0.77142 | 3 | 0 | 3 |
| TOM1L1 | MPZL3 | 0.76586 | 4 | 0 | 4 |
| TOM1L1 | FCHO2 | 0.761653 | 3 | 0 | 3 |
| TOM1L1 | CCDC154 | 0.760349 | 3 | 0 | 3 |
| TOM1L1 | SLC16A14 | 0.758564 | 3 | 0 | 3 |
| TOM1L1 | HUS1 | 0.755392 | 3 | 0 | 3 |
| TOM1L1 | HK1 | 0.752875 | 3 | 0 | 3 |
| TOM1L1 | RBKS | 0.751587 | 3 | 0 | 3 |
| TOM1L1 | TNIP1 | 0.746627 | 3 | 0 | 3 |
| TOM1L1 | JMJD1C | 0.746189 | 4 | 0 | 4 |
| TOM1L1 | ALG9 | 0.743622 | 3 | 0 | 3 |
| TOM1L1 | CPPED1 | 0.741539 | 4 | 0 | 4 |
| TOM1L1 | TYSND1 | 0.741291 | 3 | 0 | 3 |
| TOM1L1 | PZP | 0.735349 | 3 | 0 | 3 |
| TOM1L1 | ZNF638 | 0.734173 | 3 | 0 | 3 |
| TOM1L1 | PHLDA1 | 0.730064 | 3 | 0 | 3 |
| TOM1L1 | LRIG3 | 0.725186 | 3 | 0 | 3 |
For details and further investigation, click here