| Full name: phosphatidylinositol glycan anchor biosynthesis class T | Alias Symbol: | ||
| Type: protein-coding gene | Cytoband: 20q13.12 | ||
| Entrez ID: 51604 | HGNC ID: HGNC:14938 | Ensembl Gene: ENSG00000124155 | OMIM ID: 610272 |
Expression of PIGT:
| Dataset | Gene | EntrezID | Probe | Log2FC | Adj.pValue | Expression |
|---|---|---|---|---|---|---|
| GSE17351 | PIGT | 51604 | 217770_at | 0.6647 | 0.0591 | |
| GSE20347 | PIGT | 51604 | 217770_at | 0.3077 | 0.0157 | |
| GSE23400 | PIGT | 51604 | 217770_at | 0.4609 | 0.0000 | |
| GSE26886 | PIGT | 51604 | 217770_at | 1.1333 | 0.0000 | |
| GSE29001 | PIGT | 51604 | 217770_at | 0.5339 | 0.0333 | |
| GSE38129 | PIGT | 51604 | 217770_at | 0.3915 | 0.0001 | |
| GSE45670 | PIGT | 51604 | 217770_at | 0.2963 | 0.0916 | |
| GSE53622 | PIGT | 51604 | 53587 | 0.7707 | 0.0000 | |
| GSE53624 | PIGT | 51604 | 53587 | 0.6352 | 0.0000 | |
| GSE63941 | PIGT | 51604 | 217770_at | -0.6240 | 0.1698 | |
| GSE77861 | PIGT | 51604 | 217770_at | 0.1576 | 0.3222 | |
| GSE97050 | PIGT | 51604 | A_23_P79842 | 0.1360 | 0.6791 | |
| SRP007169 | PIGT | 51604 | RNAseq | 0.1882 | 0.5580 | |
| SRP008496 | PIGT | 51604 | RNAseq | 0.4602 | 0.1058 | |
| SRP064894 | PIGT | 51604 | RNAseq | 0.9502 | 0.0001 | |
| SRP133303 | PIGT | 51604 | RNAseq | 0.7035 | 0.0000 | |
| SRP159526 | PIGT | 51604 | RNAseq | 0.7791 | 0.0000 | |
| SRP193095 | PIGT | 51604 | RNAseq | 0.5488 | 0.0012 | |
| SRP219564 | PIGT | 51604 | RNAseq | 0.8246 | 0.0339 | |
| TCGA | PIGT | 51604 | RNAseq | -0.0267 | 0.5634 |
Upregulated datasets: 1; Downregulated datasets: 0.
Survival by PIGT expression:
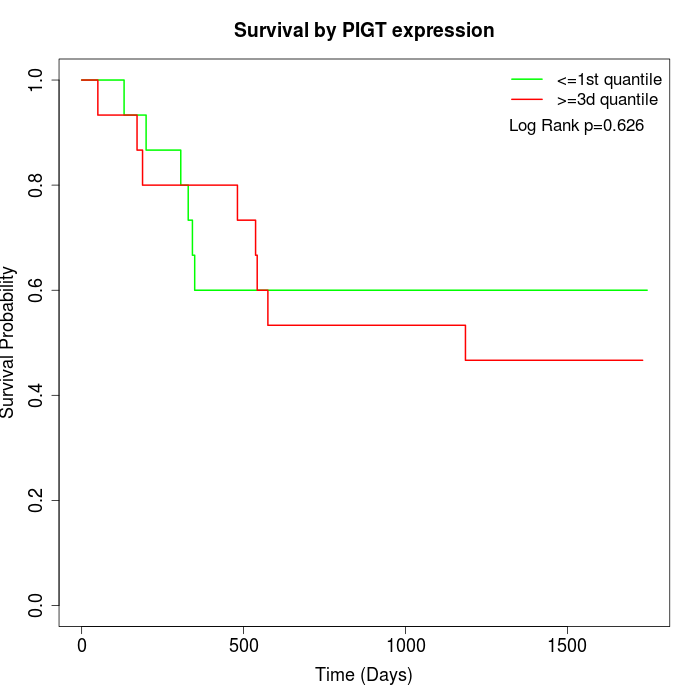 | 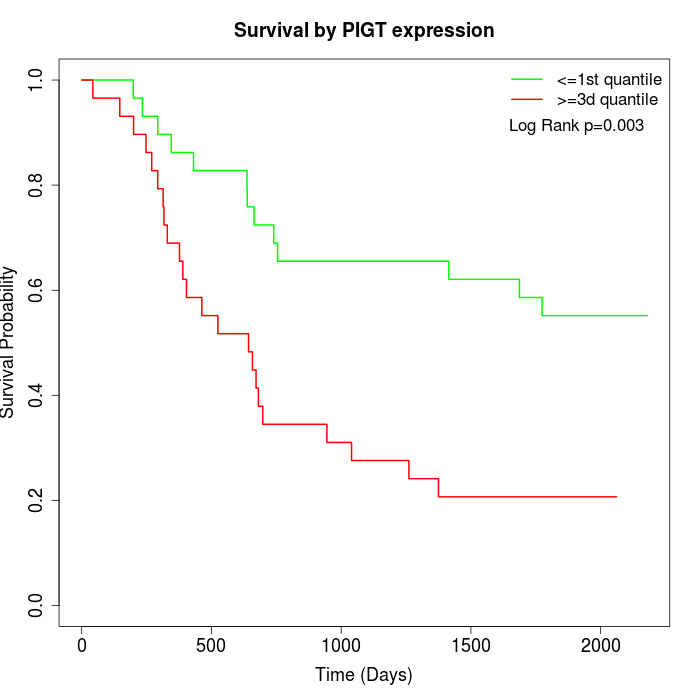 | 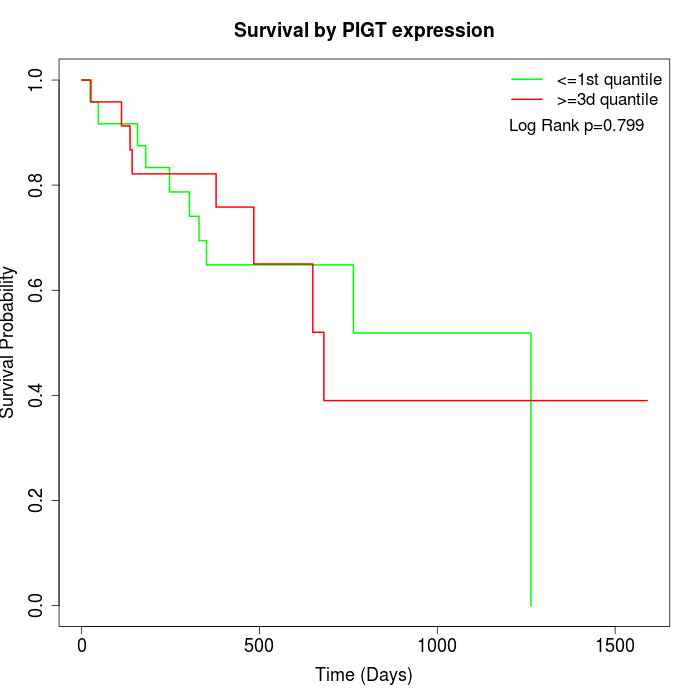 |
| GSE53622 | GSE53624 | TCGA |
Note: Click image to view full size file.
Copy number change of PIGT:
| Dataset | Gene | EntrezID | Gain | Loss | Normal | Detail |
|---|---|---|---|---|---|---|
| GSE15526 | PIGT | 51604 | 14 | 1 | 15 | |
| GSE20123 | PIGT | 51604 | 14 | 1 | 15 | |
| GSE43470 | PIGT | 51604 | 12 | 1 | 30 | |
| GSE46452 | PIGT | 51604 | 29 | 0 | 30 | |
| GSE47630 | PIGT | 51604 | 24 | 1 | 15 | |
| GSE54993 | PIGT | 51604 | 0 | 17 | 53 | |
| GSE54994 | PIGT | 51604 | 25 | 0 | 28 | |
| GSE60625 | PIGT | 51604 | 0 | 0 | 11 | |
| GSE74703 | PIGT | 51604 | 10 | 1 | 25 | |
| GSE74704 | PIGT | 51604 | 10 | 0 | 10 | |
| TCGA | PIGT | 51604 | 45 | 3 | 48 |
Total number of gains: 183; Total number of losses: 25; Total Number of normals: 280.
Somatic mutations of PIGT:
Generating mutation plots.
Highly correlated genes for PIGT:
Showing top 20/1314 corelated genes with mean PCC>0.5.
| Gene1 | Gene2 | Mean PCC | Num. Datasets | Num. PCC<0 | Num. PCC>0.5 |
|---|---|---|---|---|---|
| PIGT | KRTCAP2 | 0.747859 | 3 | 0 | 3 |
| PIGT | ROMO1 | 0.742481 | 3 | 0 | 3 |
| PIGT | PLEKHG2 | 0.720681 | 3 | 0 | 3 |
| PIGT | PKIG | 0.698961 | 3 | 0 | 3 |
| PIGT | B3GALT6 | 0.690976 | 6 | 0 | 5 |
| PIGT | LRRC14 | 0.6882 | 4 | 0 | 4 |
| PIGT | SLC19A1 | 0.687358 | 3 | 0 | 3 |
| PIGT | FADS1 | 0.686319 | 3 | 0 | 3 |
| PIGT | PLOD1 | 0.685339 | 10 | 0 | 8 |
| PIGT | KLHL13 | 0.67812 | 3 | 0 | 3 |
| PIGT | MED1 | 0.678089 | 4 | 0 | 4 |
| PIGT | PLBD2 | 0.677519 | 8 | 0 | 7 |
| PIGT | CPLX1 | 0.676828 | 3 | 0 | 3 |
| PIGT | WDR81 | 0.675648 | 3 | 0 | 3 |
| PIGT | MRGBP | 0.674253 | 10 | 0 | 9 |
| PIGT | SETD1A | 0.673986 | 5 | 0 | 5 |
| PIGT | KIF3B | 0.672988 | 12 | 0 | 11 |
| PIGT | TP53I13 | 0.671558 | 6 | 0 | 5 |
| PIGT | MYBL2 | 0.671294 | 10 | 0 | 10 |
| PIGT | SREBF1 | 0.668121 | 3 | 0 | 3 |
For details and further investigation, click here