| Full name: PITPNM family member 3 | Alias Symbol: NIR1|RDGBA3|ACKR6 | ||
| Type: protein-coding gene | Cytoband: 17p13.2-p13.1 | ||
| Entrez ID: 83394 | HGNC ID: HGNC:21043 | Ensembl Gene: ENSG00000091622 | OMIM ID: 608921 |
Expression of PITPNM3:
| Dataset | Gene | EntrezID | Probe | Log2FC | Adj.pValue | Expression |
|---|---|---|---|---|---|---|
| GSE17351 | PITPNM3 | 83394 | 230076_at | -0.7975 | 0.1886 | |
| GSE20347 | PITPNM3 | 83394 | 221254_s_at | -0.1161 | 0.0756 | |
| GSE23400 | PITPNM3 | 83394 | 221254_s_at | -0.1520 | 0.0002 | |
| GSE26886 | PITPNM3 | 83394 | 230076_at | -1.3333 | 0.0000 | |
| GSE29001 | PITPNM3 | 83394 | 221254_s_at | -0.1838 | 0.1881 | |
| GSE38129 | PITPNM3 | 83394 | 221254_s_at | -0.1320 | 0.0181 | |
| GSE45670 | PITPNM3 | 83394 | 230076_at | -0.5473 | 0.0379 | |
| GSE53622 | PITPNM3 | 83394 | 61285 | -1.3093 | 0.0000 | |
| GSE53624 | PITPNM3 | 83394 | 61285 | -1.2282 | 0.0000 | |
| GSE63941 | PITPNM3 | 83394 | 230076_at | 1.7093 | 0.0074 | |
| GSE77861 | PITPNM3 | 83394 | 230076_at | -0.3964 | 0.2544 | |
| GSE97050 | PITPNM3 | 83394 | A_33_P3342561 | -1.3230 | 0.0737 | |
| SRP007169 | PITPNM3 | 83394 | RNAseq | -0.2845 | 0.6098 | |
| SRP008496 | PITPNM3 | 83394 | RNAseq | -0.4435 | 0.2462 | |
| SRP064894 | PITPNM3 | 83394 | RNAseq | -1.4206 | 0.0000 | |
| SRP133303 | PITPNM3 | 83394 | RNAseq | -1.3924 | 0.0000 | |
| SRP159526 | PITPNM3 | 83394 | RNAseq | -1.2278 | 0.0039 | |
| SRP193095 | PITPNM3 | 83394 | RNAseq | -1.0884 | 0.0000 | |
| SRP219564 | PITPNM3 | 83394 | RNAseq | -0.9264 | 0.0906 | |
| TCGA | PITPNM3 | 83394 | RNAseq | -0.2140 | 0.0801 |
Upregulated datasets: 1; Downregulated datasets: 7.
Survival by PITPNM3 expression:
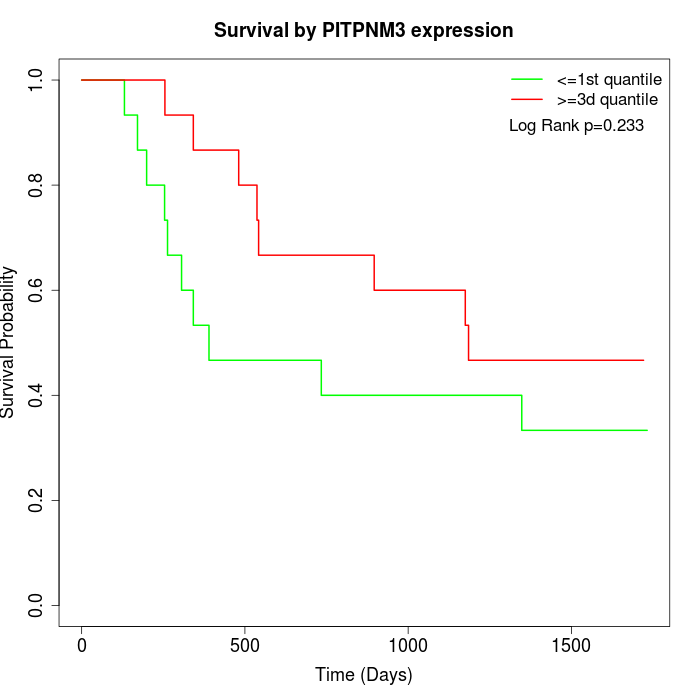 | 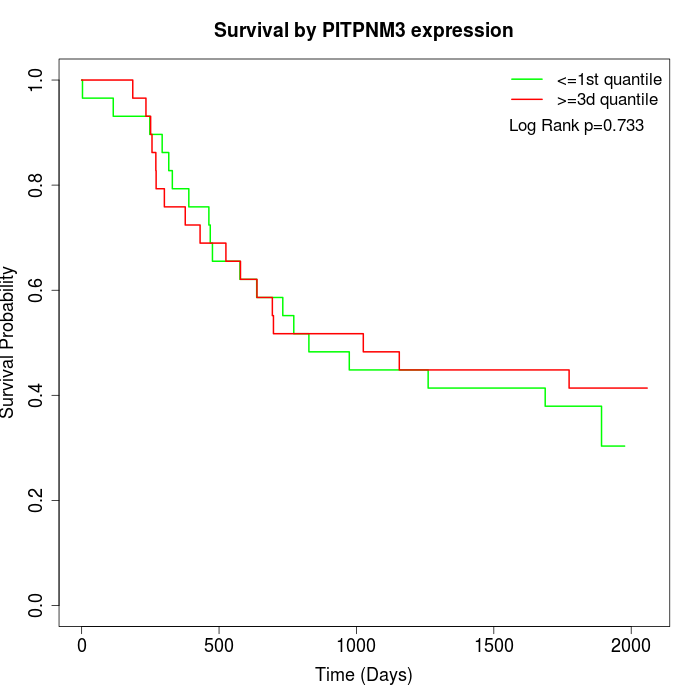 | 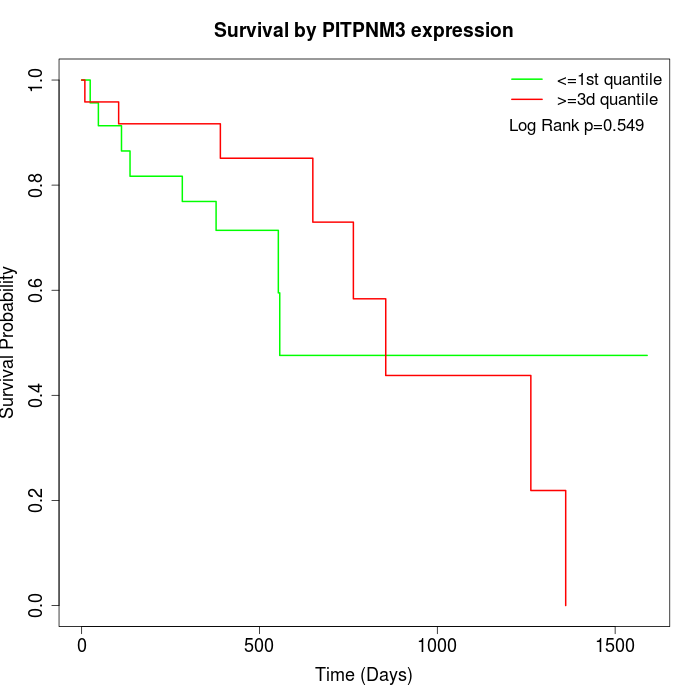 |
| GSE53622 | GSE53624 | TCGA |
Note: Click image to view full size file.
Copy number change of PITPNM3:
| Dataset | Gene | EntrezID | Gain | Loss | Normal | Detail |
|---|---|---|---|---|---|---|
| GSE15526 | PITPNM3 | 83394 | 4 | 2 | 24 | |
| GSE20123 | PITPNM3 | 83394 | 4 | 3 | 23 | |
| GSE43470 | PITPNM3 | 83394 | 1 | 6 | 36 | |
| GSE46452 | PITPNM3 | 83394 | 34 | 1 | 24 | |
| GSE47630 | PITPNM3 | 83394 | 7 | 1 | 32 | |
| GSE54993 | PITPNM3 | 83394 | 4 | 3 | 63 | |
| GSE54994 | PITPNM3 | 83394 | 5 | 8 | 40 | |
| GSE60625 | PITPNM3 | 83394 | 4 | 0 | 7 | |
| GSE74703 | PITPNM3 | 83394 | 1 | 3 | 32 | |
| GSE74704 | PITPNM3 | 83394 | 2 | 1 | 17 |
Total number of gains: 66; Total number of losses: 28; Total Number of normals: 298.
Somatic mutations of PITPNM3:
Generating mutation plots.
Highly correlated genes for PITPNM3:
Showing top 20/989 corelated genes with mean PCC>0.5.
| Gene1 | Gene2 | Mean PCC | Num. Datasets | Num. PCC<0 | Num. PCC>0.5 |
|---|---|---|---|---|---|
| PITPNM3 | SERINC1 | 0.823789 | 3 | 0 | 3 |
| PITPNM3 | HSPA2 | 0.778031 | 3 | 0 | 3 |
| PITPNM3 | RNF14 | 0.771447 | 3 | 0 | 3 |
| PITPNM3 | KDM3B | 0.765044 | 3 | 0 | 3 |
| PITPNM3 | MTA3 | 0.752469 | 3 | 0 | 3 |
| PITPNM3 | MYO9A | 0.746446 | 3 | 0 | 3 |
| PITPNM3 | UGP2 | 0.744227 | 4 | 0 | 3 |
| PITPNM3 | MIER3 | 0.741825 | 3 | 0 | 3 |
| PITPNM3 | CRYZ | 0.719645 | 3 | 0 | 3 |
| PITPNM3 | CUL5 | 0.719619 | 3 | 0 | 3 |
| PITPNM3 | EXD2 | 0.716009 | 4 | 0 | 3 |
| PITPNM3 | DCTN4 | 0.714659 | 3 | 0 | 3 |
| PITPNM3 | AKIP1 | 0.713998 | 3 | 0 | 3 |
| PITPNM3 | LYRM7 | 0.713295 | 5 | 0 | 4 |
| PITPNM3 | FAM8A1 | 0.712391 | 4 | 0 | 3 |
| PITPNM3 | ABLIM2 | 0.710262 | 4 | 0 | 4 |
| PITPNM3 | CGGBP1 | 0.706652 | 4 | 0 | 3 |
| PITPNM3 | PEX19 | 0.704175 | 3 | 0 | 3 |
| PITPNM3 | TMEM159 | 0.701327 | 6 | 0 | 6 |
| PITPNM3 | LYSMD3 | 0.699801 | 4 | 0 | 3 |
For details and further investigation, click here