| Full name: phospholipase C delta 1 | Alias Symbol: | ||
| Type: protein-coding gene | Cytoband: 3p22.2 | ||
| Entrez ID: 5333 | HGNC ID: HGNC:9060 | Ensembl Gene: ENSG00000187091 | OMIM ID: 602142 |
PLCD1 involved pathways:
| KEGG pathway | Description | View |
|---|---|---|
| hsa04020 | Calcium signaling pathway | |
| hsa04919 | Thyroid hormone signaling pathway | |
| hsa04933 | AGE-RAGE signaling pathway in diabetic complications |
Expression of PLCD1:
| Dataset | Gene | EntrezID | Probe | Log2FC | Adj.pValue | Expression |
|---|---|---|---|---|---|---|
| GSE17351 | PLCD1 | 5333 | 205125_at | -0.6964 | 0.0943 | |
| GSE20347 | PLCD1 | 5333 | 205125_at | -1.0742 | 0.0000 | |
| GSE23400 | PLCD1 | 5333 | 205125_at | -0.4202 | 0.0000 | |
| GSE26886 | PLCD1 | 5333 | 205125_at | -1.1222 | 0.0000 | |
| GSE29001 | PLCD1 | 5333 | 205125_at | -1.1239 | 0.0000 | |
| GSE38129 | PLCD1 | 5333 | 205125_at | -1.0133 | 0.0000 | |
| GSE45670 | PLCD1 | 5333 | 205125_at | -0.2430 | 0.1924 | |
| GSE53622 | PLCD1 | 5333 | 74445 | -1.6430 | 0.0000 | |
| GSE53624 | PLCD1 | 5333 | 74445 | -1.5816 | 0.0000 | |
| GSE63941 | PLCD1 | 5333 | 205125_at | -0.2828 | 0.4785 | |
| GSE77861 | PLCD1 | 5333 | 205125_at | -0.6955 | 0.0206 | |
| GSE97050 | PLCD1 | 5333 | A_23_P80739 | -0.4177 | 0.3666 | |
| SRP007169 | PLCD1 | 5333 | RNAseq | -2.7678 | 0.0000 | |
| SRP008496 | PLCD1 | 5333 | RNAseq | -2.2225 | 0.0000 | |
| SRP064894 | PLCD1 | 5333 | RNAseq | -1.1564 | 0.0000 | |
| SRP133303 | PLCD1 | 5333 | RNAseq | -2.0425 | 0.0000 | |
| SRP159526 | PLCD1 | 5333 | RNAseq | -1.2358 | 0.0280 | |
| SRP193095 | PLCD1 | 5333 | RNAseq | -1.8947 | 0.0000 | |
| SRP219564 | PLCD1 | 5333 | RNAseq | -2.0290 | 0.0000 | |
| TCGA | PLCD1 | 5333 | RNAseq | -0.1289 | 0.2697 |
Upregulated datasets: 0; Downregulated datasets: 13.
Survival by PLCD1 expression:
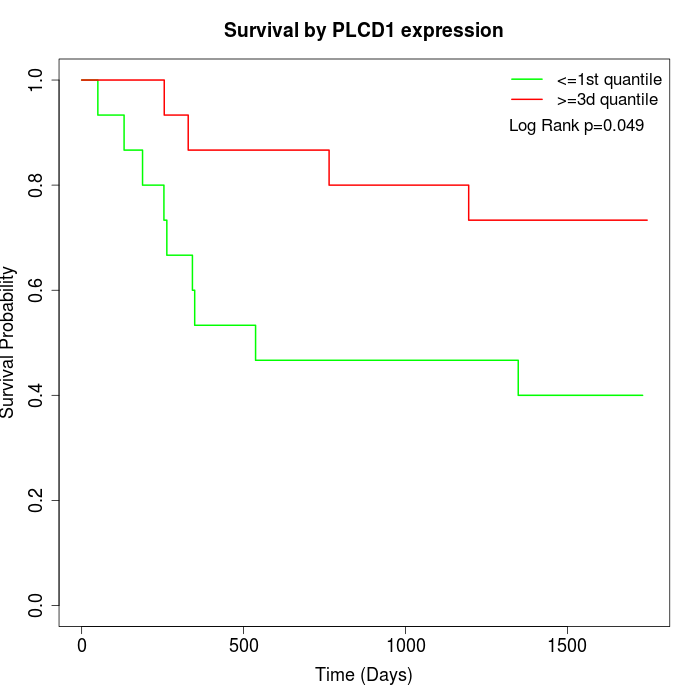 | 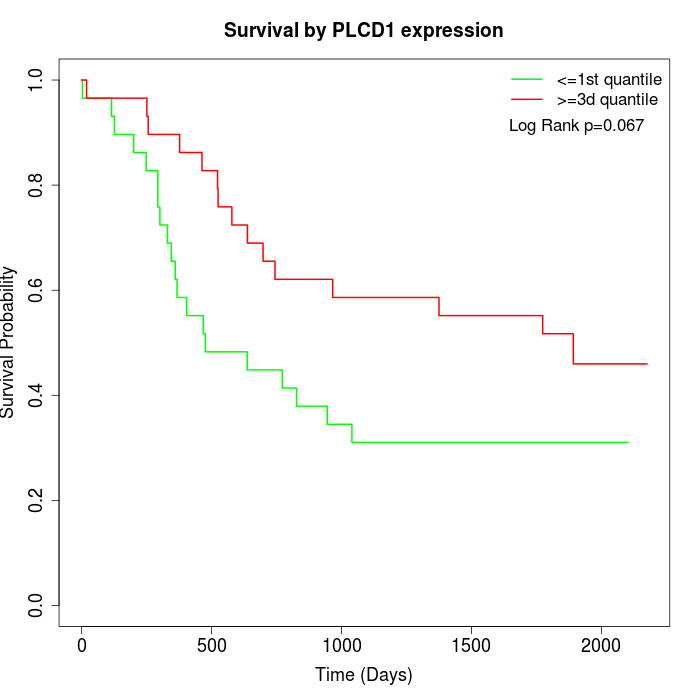 | 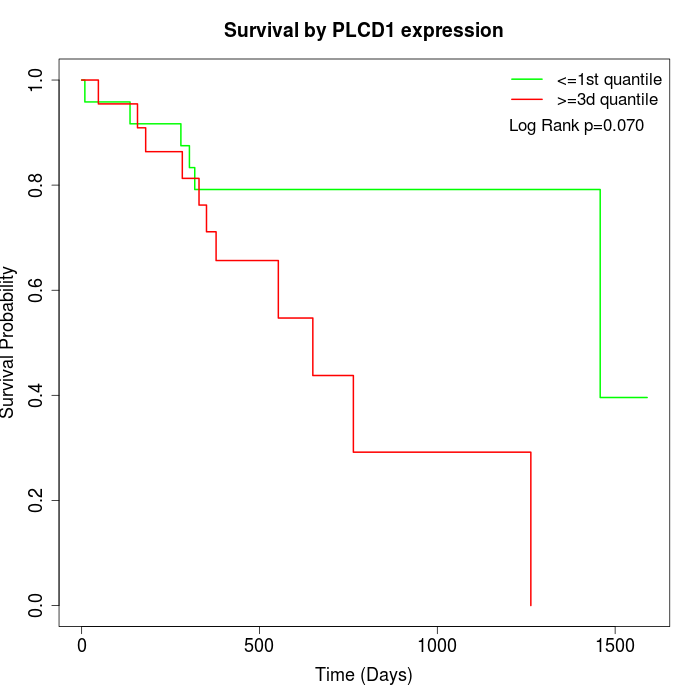 |
| GSE53622 | GSE53624 | TCGA |
Note: Click image to view full size file.
Copy number change of PLCD1:
| Dataset | Gene | EntrezID | Gain | Loss | Normal | Detail |
|---|---|---|---|---|---|---|
| GSE15526 | PLCD1 | 5333 | 0 | 19 | 11 | |
| GSE20123 | PLCD1 | 5333 | 0 | 19 | 11 | |
| GSE43470 | PLCD1 | 5333 | 0 | 20 | 23 | |
| GSE46452 | PLCD1 | 5333 | 2 | 17 | 40 | |
| GSE47630 | PLCD1 | 5333 | 1 | 25 | 14 | |
| GSE54993 | PLCD1 | 5333 | 6 | 3 | 61 | |
| GSE54994 | PLCD1 | 5333 | 1 | 33 | 19 | |
| GSE60625 | PLCD1 | 5333 | 5 | 0 | 6 | |
| GSE74703 | PLCD1 | 5333 | 0 | 16 | 20 | |
| GSE74704 | PLCD1 | 5333 | 0 | 13 | 7 | |
| TCGA | PLCD1 | 5333 | 1 | 71 | 24 |
Total number of gains: 16; Total number of losses: 236; Total Number of normals: 236.
Somatic mutations of PLCD1:
Generating mutation plots.
Highly correlated genes for PLCD1:
Showing top 20/1710 corelated genes with mean PCC>0.5.
| Gene1 | Gene2 | Mean PCC | Num. Datasets | Num. PCC<0 | Num. PCC>0.5 |
|---|---|---|---|---|---|
| PLCD1 | VSIG10L | 0.816296 | 6 | 0 | 6 |
| PLCD1 | CYSRT1 | 0.807942 | 6 | 0 | 6 |
| PLCD1 | EVPL | 0.80603 | 10 | 0 | 10 |
| PLCD1 | SLURP1 | 0.797498 | 10 | 0 | 10 |
| PLCD1 | SFTA2 | 0.79657 | 4 | 0 | 4 |
| PLCD1 | SCNN1B | 0.791078 | 10 | 0 | 10 |
| PLCD1 | DEGS2 | 0.790765 | 6 | 0 | 6 |
| PLCD1 | ZNF185 | 0.786399 | 10 | 0 | 10 |
| PLCD1 | RAET1E | 0.784213 | 6 | 0 | 6 |
| PLCD1 | SLC16A6 | 0.781855 | 11 | 0 | 11 |
| PLCD1 | CNFN | 0.779461 | 6 | 0 | 6 |
| PLCD1 | BNIPL | 0.778867 | 6 | 0 | 6 |
| PLCD1 | ENDOU | 0.778854 | 11 | 0 | 11 |
| PLCD1 | TOM1 | 0.776851 | 11 | 0 | 11 |
| PLCD1 | ANKRD35 | 0.7745 | 7 | 0 | 7 |
| PLCD1 | CXCR2 | 0.774308 | 11 | 0 | 11 |
| PLCD1 | MALL | 0.773729 | 10 | 0 | 10 |
| PLCD1 | ALS2CL | 0.773676 | 11 | 0 | 10 |
| PLCD1 | CRABP2 | 0.773284 | 10 | 0 | 10 |
| PLCD1 | SCEL | 0.771867 | 10 | 0 | 10 |
For details and further investigation, click here