| Full name: phospholipase C eta 1 | Alias Symbol: KIAA1069|MGC117152|DKFZp434C1372|PLCeta1 | ||
| Type: protein-coding gene | Cytoband: 3q25.31 | ||
| Entrez ID: 23007 | HGNC ID: HGNC:29185 | Ensembl Gene: ENSG00000114805 | OMIM ID: 612835 |
Expression of PLCH1:
| Dataset | Gene | EntrezID | Probe | Log2FC | Adj.pValue | Expression |
|---|---|---|---|---|---|---|
| GSE17351 | PLCH1 | 23007 | 214745_at | 0.5284 | 0.0493 | |
| GSE20347 | PLCH1 | 23007 | 216633_s_at | -0.0791 | 0.1171 | |
| GSE23400 | PLCH1 | 23007 | 216633_s_at | -0.0383 | 0.3565 | |
| GSE26886 | PLCH1 | 23007 | 216633_s_at | 0.1058 | 0.2258 | |
| GSE29001 | PLCH1 | 23007 | 214745_at | 0.3818 | 0.1070 | |
| GSE38129 | PLCH1 | 23007 | 216633_s_at | -0.1051 | 0.0308 | |
| GSE45670 | PLCH1 | 23007 | 214745_at | 0.2394 | 0.1476 | |
| GSE53622 | PLCH1 | 23007 | 123091 | 0.7913 | 0.0048 | |
| GSE53624 | PLCH1 | 23007 | 123091 | 1.3108 | 0.0000 | |
| GSE63941 | PLCH1 | 23007 | 216633_s_at | -0.0584 | 0.6841 | |
| GSE77861 | PLCH1 | 23007 | 216633_s_at | -0.0650 | 0.5810 | |
| SRP007169 | PLCH1 | 23007 | RNAseq | 3.5640 | 0.0001 | |
| SRP133303 | PLCH1 | 23007 | RNAseq | 1.5638 | 0.0078 | |
| SRP159526 | PLCH1 | 23007 | RNAseq | 3.5242 | 0.0000 | |
| TCGA | PLCH1 | 23007 | RNAseq | -0.8239 | 0.0166 |
Upregulated datasets: 4; Downregulated datasets: 0.
Survival by PLCH1 expression:
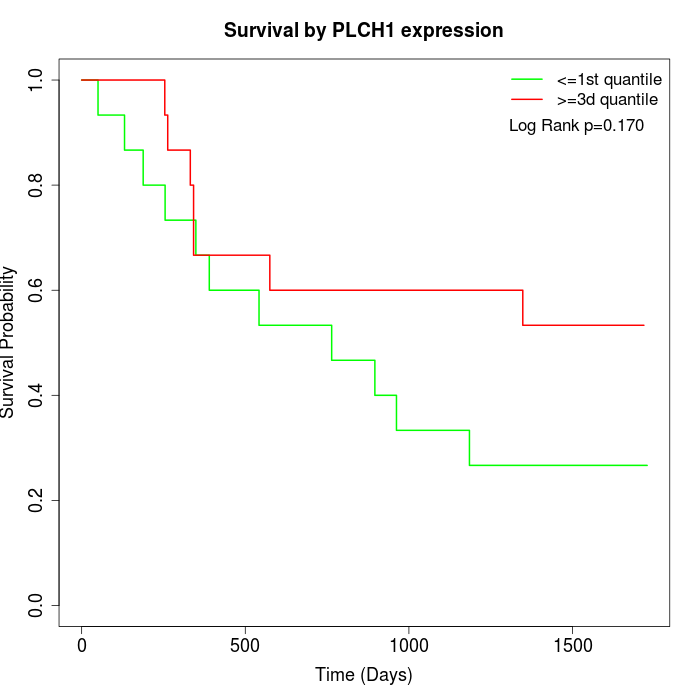 | 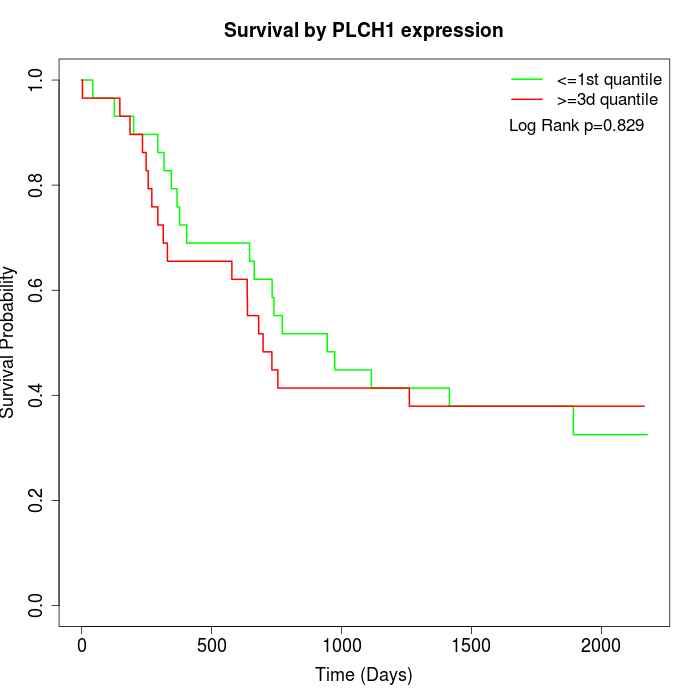 | 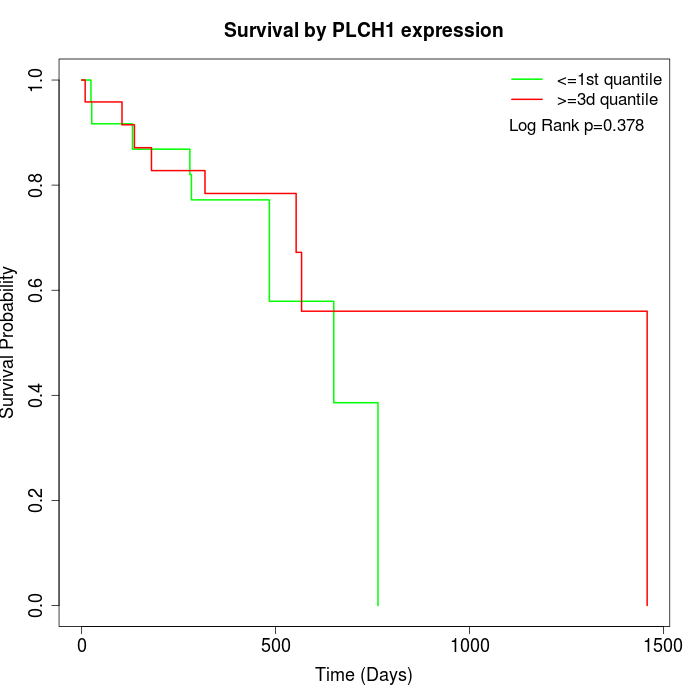 |
| GSE53622 | GSE53624 | TCGA |
Note: Click image to view full size file.
Copy number change of PLCH1:
| Dataset | Gene | EntrezID | Gain | Loss | Normal | Detail |
|---|---|---|---|---|---|---|
| GSE15526 | PLCH1 | 23007 | 21 | 1 | 8 | |
| GSE20123 | PLCH1 | 23007 | 21 | 1 | 8 | |
| GSE43470 | PLCH1 | 23007 | 23 | 0 | 20 | |
| GSE46452 | PLCH1 | 23007 | 18 | 2 | 39 | |
| GSE47630 | PLCH1 | 23007 | 19 | 3 | 18 | |
| GSE54993 | PLCH1 | 23007 | 1 | 11 | 58 | |
| GSE54994 | PLCH1 | 23007 | 38 | 1 | 14 | |
| GSE60625 | PLCH1 | 23007 | 0 | 6 | 5 | |
| GSE74703 | PLCH1 | 23007 | 20 | 0 | 16 | |
| GSE74704 | PLCH1 | 23007 | 14 | 0 | 6 | |
| TCGA | PLCH1 | 23007 | 73 | 1 | 22 |
Total number of gains: 248; Total number of losses: 26; Total Number of normals: 214.
Somatic mutations of PLCH1:
Generating mutation plots.
Highly correlated genes for PLCH1:
Showing top 20/119 corelated genes with mean PCC>0.5.
| Gene1 | Gene2 | Mean PCC | Num. Datasets | Num. PCC<0 | Num. PCC>0.5 |
|---|---|---|---|---|---|
| PLCH1 | BAHD1 | 0.738415 | 3 | 0 | 3 |
| PLCH1 | DNMT3L | 0.672039 | 3 | 0 | 3 |
| PLCH1 | FCHO1 | 0.662451 | 5 | 0 | 5 |
| PLCH1 | SERPINC1 | 0.642753 | 3 | 0 | 3 |
| PLCH1 | BFSP2 | 0.635859 | 3 | 0 | 3 |
| PLCH1 | PXYLP1 | 0.634248 | 4 | 0 | 4 |
| PLCH1 | SOX30 | 0.627482 | 3 | 0 | 3 |
| PLCH1 | GABRD | 0.624485 | 3 | 0 | 3 |
| PLCH1 | CCDC33 | 0.622615 | 3 | 0 | 3 |
| PLCH1 | VN1R4 | 0.622288 | 3 | 0 | 3 |
| PLCH1 | HRH3 | 0.616024 | 3 | 0 | 3 |
| PLCH1 | FOXS1 | 0.609229 | 3 | 0 | 3 |
| PLCH1 | MYH13 | 0.60825 | 3 | 0 | 3 |
| PLCH1 | PRKD2 | 0.606427 | 3 | 0 | 3 |
| PLCH1 | POU2F2 | 0.604287 | 3 | 0 | 3 |
| PLCH1 | PRR5 | 0.602308 | 4 | 0 | 3 |
| PLCH1 | LILRA4 | 0.600681 | 4 | 0 | 3 |
| PLCH1 | ESR1 | 0.596278 | 4 | 0 | 4 |
| PLCH1 | PNLIPRP1 | 0.595124 | 3 | 0 | 3 |
| PLCH1 | TGIF2 | 0.594593 | 5 | 0 | 4 |
For details and further investigation, click here