| Full name: UTP15 small subunit processome component | Alias Symbol: FLJ12787|NET21|FLJ23637 | ||
| Type: protein-coding gene | Cytoband: 5q13.2 | ||
| Entrez ID: 84135 | HGNC ID: HGNC:25758 | Ensembl Gene: ENSG00000164338 | OMIM ID: 616194 |
Screen Evidence:
| |||
Expression of UTP15:
| Dataset | Gene | EntrezID | Probe | Log2FC | Adj.pValue | Expression |
|---|---|---|---|---|---|---|
| GSE17351 | UTP15 | 84135 | 228050_at | 0.5107 | 0.4767 | |
| GSE26886 | UTP15 | 84135 | 228050_at | 0.1508 | 0.4875 | |
| GSE45670 | UTP15 | 84135 | 228050_at | 0.2702 | 0.1684 | |
| GSE53622 | UTP15 | 84135 | 5662 | -0.0885 | 0.3360 | |
| GSE53624 | UTP15 | 84135 | 5662 | 0.1532 | 0.0308 | |
| GSE63941 | UTP15 | 84135 | 228050_at | 0.3663 | 0.5172 | |
| GSE77861 | UTP15 | 84135 | 228050_at | 0.0909 | 0.7017 | |
| GSE97050 | UTP15 | 84135 | A_23_P213441 | 0.3455 | 0.1694 | |
| SRP007169 | UTP15 | 84135 | RNAseq | 0.4736 | 0.2222 | |
| SRP008496 | UTP15 | 84135 | RNAseq | 0.7294 | 0.0268 | |
| SRP064894 | UTP15 | 84135 | RNAseq | -0.0673 | 0.6667 | |
| SRP133303 | UTP15 | 84135 | RNAseq | 0.2985 | 0.0725 | |
| SRP159526 | UTP15 | 84135 | RNAseq | 0.2035 | 0.5536 | |
| SRP193095 | UTP15 | 84135 | RNAseq | -0.1017 | 0.3514 | |
| SRP219564 | UTP15 | 84135 | RNAseq | -0.1628 | 0.5623 | |
| TCGA | UTP15 | 84135 | RNAseq | 0.0034 | 0.9572 |
Upregulated datasets: 0; Downregulated datasets: 0.
Survival by UTP15 expression:
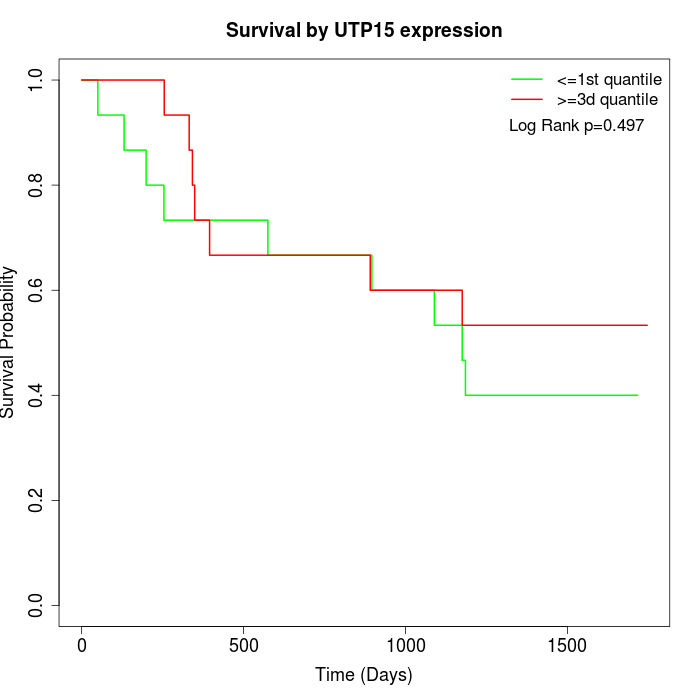 | 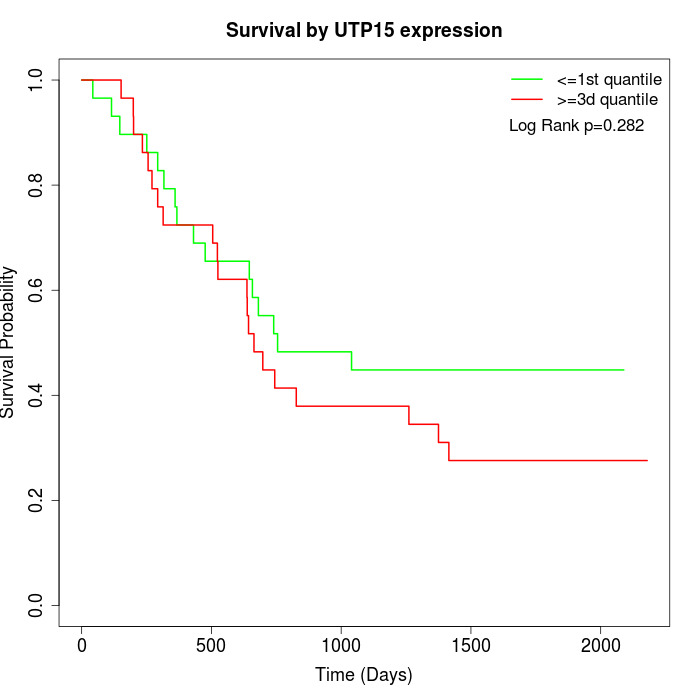 | 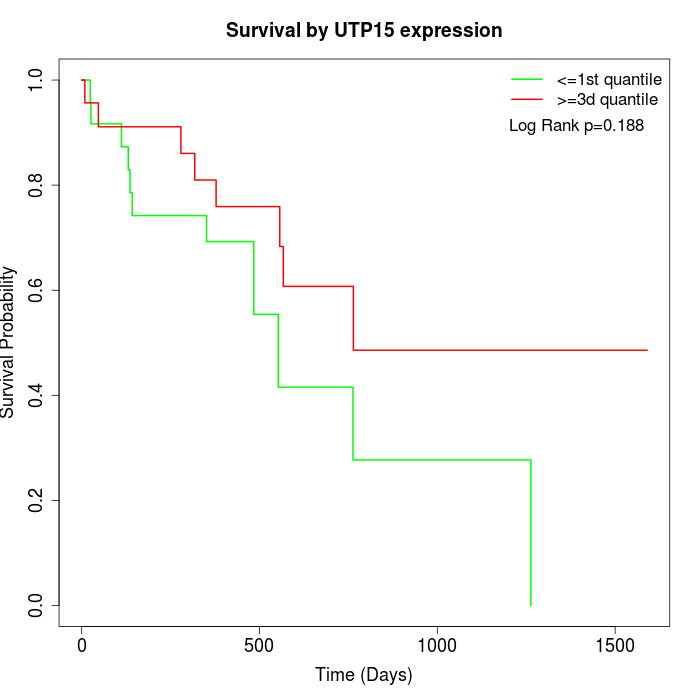 |
| GSE53622 | GSE53624 | TCGA |
Note: Click image to view full size file.
Copy number change of UTP15:
| Dataset | Gene | EntrezID | Gain | Loss | Normal | Detail |
|---|---|---|---|---|---|---|
| GSE15526 | UTP15 | 84135 | 1 | 13 | 16 | |
| GSE20123 | UTP15 | 84135 | 1 | 13 | 16 | |
| GSE43470 | UTP15 | 84135 | 1 | 13 | 29 | |
| GSE46452 | UTP15 | 84135 | 0 | 28 | 31 | |
| GSE47630 | UTP15 | 84135 | 1 | 19 | 20 | |
| GSE54993 | UTP15 | 84135 | 8 | 1 | 61 | |
| GSE54994 | UTP15 | 84135 | 1 | 19 | 33 | |
| GSE60625 | UTP15 | 84135 | 0 | 0 | 11 | |
| GSE74703 | UTP15 | 84135 | 1 | 9 | 26 | |
| GSE74704 | UTP15 | 84135 | 1 | 6 | 13 | |
| TCGA | UTP15 | 84135 | 5 | 50 | 41 |
Total number of gains: 20; Total number of losses: 171; Total Number of normals: 297.
Somatic mutations of UTP15:
Generating mutation plots.
Highly correlated genes for UTP15:
Showing top 20/250 corelated genes with mean PCC>0.5.
| Gene1 | Gene2 | Mean PCC | Num. Datasets | Num. PCC<0 | Num. PCC>0.5 |
|---|---|---|---|---|---|
| UTP15 | ARL10 | 0.729139 | 3 | 0 | 3 |
| UTP15 | C11orf24 | 0.71936 | 3 | 0 | 3 |
| UTP15 | SULF2 | 0.718483 | 3 | 0 | 3 |
| UTP15 | SMOX | 0.710821 | 3 | 0 | 3 |
| UTP15 | SNX5 | 0.709357 | 3 | 0 | 3 |
| UTP15 | NUP107 | 0.708671 | 3 | 0 | 3 |
| UTP15 | MPP6 | 0.7031 | 4 | 0 | 3 |
| UTP15 | CCDC102B | 0.700972 | 3 | 0 | 3 |
| UTP15 | PLEK2 | 0.700314 | 4 | 0 | 3 |
| UTP15 | IARS2 | 0.69582 | 3 | 0 | 3 |
| UTP15 | POFUT1 | 0.694331 | 3 | 0 | 3 |
| UTP15 | PNP | 0.694181 | 3 | 0 | 3 |
| UTP15 | RAE1 | 0.689454 | 3 | 0 | 3 |
| UTP15 | CEBPB | 0.687755 | 3 | 0 | 3 |
| UTP15 | TDRD5 | 0.684836 | 3 | 0 | 3 |
| UTP15 | MED1 | 0.682661 | 3 | 0 | 3 |
| UTP15 | MYH10 | 0.680261 | 3 | 0 | 3 |
| UTP15 | MRPS5 | 0.679067 | 3 | 0 | 3 |
| UTP15 | PTPN1 | 0.678745 | 3 | 0 | 3 |
| UTP15 | UBE2E3 | 0.678325 | 3 | 0 | 3 |
For details and further investigation, click here