| Full name: peripheral myelin protein 2 | Alias Symbol: MP2|FABP8|M-FABP | ||
| Type: protein-coding gene | Cytoband: 8q21.13 | ||
| Entrez ID: 5375 | HGNC ID: HGNC:9117 | Ensembl Gene: ENSG00000147588 | OMIM ID: 170715 |
Expression of PMP2:
| Dataset | Gene | EntrezID | Probe | Log2FC | Adj.pValue | Expression |
|---|---|---|---|---|---|---|
| GSE17351 | PMP2 | 5375 | 206826_at | -0.3143 | 0.2047 | |
| GSE20347 | PMP2 | 5375 | 206826_at | -0.0349 | 0.6328 | |
| GSE23400 | PMP2 | 5375 | 206826_at | -0.0859 | 0.0000 | |
| GSE26886 | PMP2 | 5375 | 206826_at | 0.2714 | 0.2933 | |
| GSE29001 | PMP2 | 5375 | 206826_at | -0.1518 | 0.1912 | |
| GSE38129 | PMP2 | 5375 | 206826_at | -0.9146 | 0.0147 | |
| GSE45670 | PMP2 | 5375 | 206826_at | -0.6926 | 0.0000 | |
| GSE53622 | PMP2 | 5375 | 27315 | -0.6807 | 0.0004 | |
| GSE53624 | PMP2 | 5375 | 27315 | -0.9984 | 0.0000 | |
| GSE63941 | PMP2 | 5375 | 206826_at | 0.0912 | 0.5044 | |
| GSE77861 | PMP2 | 5375 | 206826_at | 0.0087 | 0.9241 | |
| SRP133303 | PMP2 | 5375 | RNAseq | 0.5656 | 0.0628 | |
| SRP159526 | PMP2 | 5375 | RNAseq | -0.5615 | 0.3107 | |
| TCGA | PMP2 | 5375 | RNAseq | -1.8560 | 0.0000 |
Upregulated datasets: 0; Downregulated datasets: 1.
Survival by PMP2 expression:
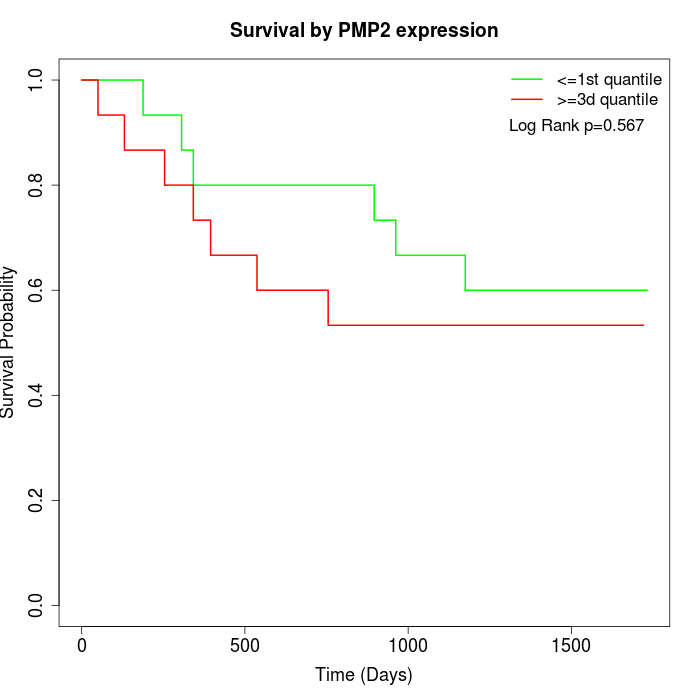 | 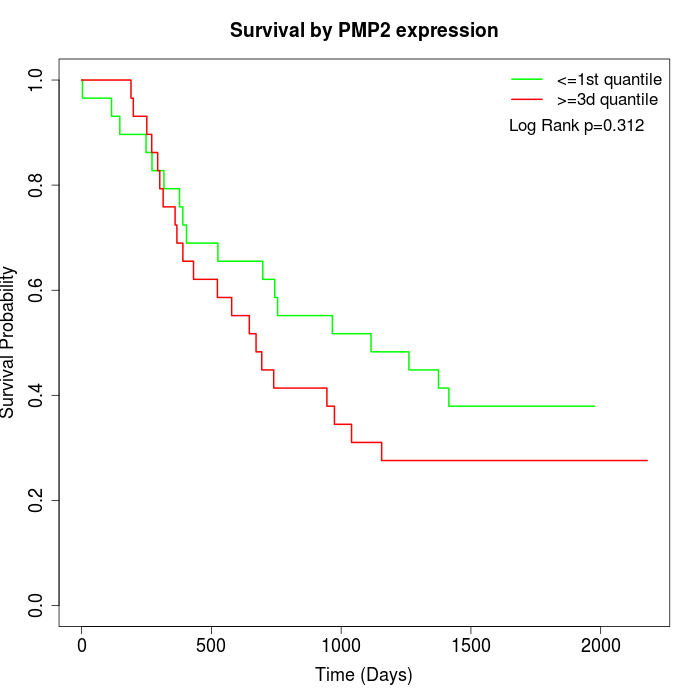 | 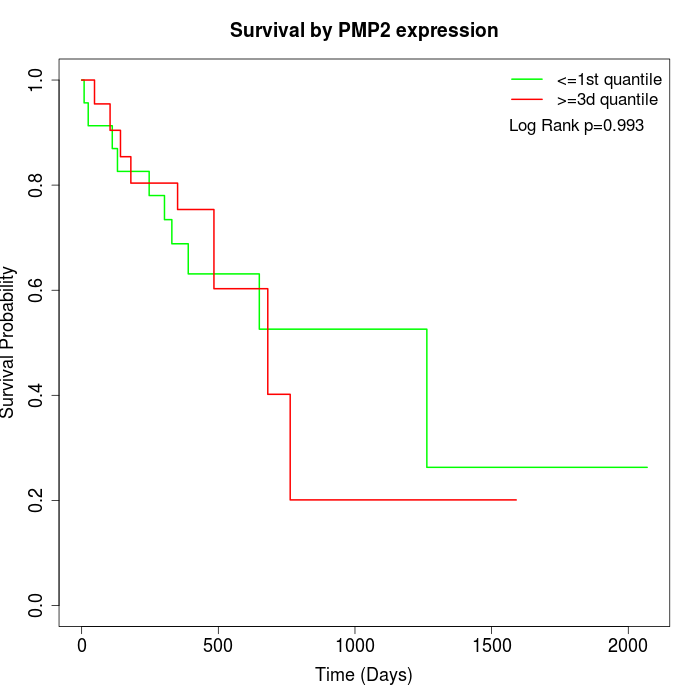 |
| GSE53622 | GSE53624 | TCGA |
Note: Click image to view full size file.
Copy number change of PMP2:
| Dataset | Gene | EntrezID | Gain | Loss | Normal | Detail |
|---|---|---|---|---|---|---|
| GSE15526 | PMP2 | 5375 | 16 | 1 | 13 | |
| GSE20123 | PMP2 | 5375 | 18 | 1 | 11 | |
| GSE43470 | PMP2 | 5375 | 18 | 1 | 24 | |
| GSE46452 | PMP2 | 5375 | 21 | 0 | 38 | |
| GSE47630 | PMP2 | 5375 | 23 | 0 | 17 | |
| GSE54993 | PMP2 | 5375 | 0 | 19 | 51 | |
| GSE54994 | PMP2 | 5375 | 30 | 0 | 23 | |
| GSE60625 | PMP2 | 5375 | 0 | 4 | 7 | |
| GSE74703 | PMP2 | 5375 | 15 | 1 | 20 | |
| GSE74704 | PMP2 | 5375 | 12 | 0 | 8 | |
| TCGA | PMP2 | 5375 | 50 | 3 | 43 |
Total number of gains: 203; Total number of losses: 30; Total Number of normals: 255.
Somatic mutations of PMP2:
Generating mutation plots.
Highly correlated genes for PMP2:
Showing top 20/210 corelated genes with mean PCC>0.5.
| Gene1 | Gene2 | Mean PCC | Num. Datasets | Num. PCC<0 | Num. PCC>0.5 |
|---|---|---|---|---|---|
| PMP2 | NIPSNAP3B | 0.756886 | 3 | 0 | 3 |
| PMP2 | HOXA4 | 0.64051 | 4 | 0 | 3 |
| PMP2 | ANGPTL1 | 0.638264 | 4 | 0 | 3 |
| PMP2 | TMOD1 | 0.636092 | 5 | 0 | 4 |
| PMP2 | EMCN | 0.635819 | 4 | 0 | 4 |
| PMP2 | EBF2 | 0.635258 | 4 | 0 | 4 |
| PMP2 | NR2F2-AS1 | 0.625108 | 4 | 0 | 3 |
| PMP2 | SLIT3 | 0.6235 | 5 | 0 | 4 |
| PMP2 | UBXN10-AS1 | 0.622562 | 4 | 0 | 4 |
| PMP2 | ZNF423 | 0.620686 | 4 | 0 | 3 |
| PMP2 | CDH19 | 0.618937 | 7 | 0 | 5 |
| PMP2 | CDKN1C | 0.617823 | 3 | 0 | 3 |
| PMP2 | STARD8 | 0.615989 | 5 | 0 | 3 |
| PMP2 | ZFHX2 | 0.612721 | 3 | 0 | 3 |
| PMP2 | NOVA1 | 0.612489 | 5 | 0 | 4 |
| PMP2 | MYOM1 | 0.6089 | 7 | 0 | 6 |
| PMP2 | KBTBD11 | 0.606527 | 4 | 0 | 3 |
| PMP2 | MYOT | 0.604547 | 8 | 0 | 6 |
| PMP2 | THPO | 0.604442 | 4 | 0 | 3 |
| PMP2 | SEMA3G | 0.599988 | 6 | 0 | 4 |
For details and further investigation, click here