| Full name: palmitoyl-protein thioesterase 1 | Alias Symbol: CLN1|INCL | ||
| Type: protein-coding gene | Cytoband: 1p34.2 | ||
| Entrez ID: 5538 | HGNC ID: HGNC:9325 | Ensembl Gene: ENSG00000131238 | OMIM ID: 600722 |
| Related drugs: LAMOTRIGINE... [more] | |||
Expression of PPT1:
| Dataset | Gene | EntrezID | Probe | Log2FC | Adj.pValue | Expression |
|---|---|---|---|---|---|---|
| GSE17351 | PPT1 | 5538 | 200975_at | 0.6213 | 0.1584 | |
| GSE20347 | PPT1 | 5538 | 200975_at | 1.0927 | 0.0000 | |
| GSE23400 | PPT1 | 5538 | 200975_at | 1.0571 | 0.0000 | |
| GSE26886 | PPT1 | 5538 | 200975_at | 1.6907 | 0.0000 | |
| GSE29001 | PPT1 | 5538 | 200975_at | 1.0664 | 0.0286 | |
| GSE38129 | PPT1 | 5538 | 200975_at | 0.8974 | 0.0000 | |
| GSE45670 | PPT1 | 5538 | 200975_at | 0.4692 | 0.0358 | |
| GSE53622 | PPT1 | 5538 | 33828 | 1.1383 | 0.0000 | |
| GSE53624 | PPT1 | 5538 | 47060 | 1.2334 | 0.0000 | |
| GSE63941 | PPT1 | 5538 | 200975_at | 1.3801 | 0.0085 | |
| GSE77861 | PPT1 | 5538 | 200975_at | 1.0623 | 0.0065 | |
| GSE97050 | PPT1 | 5538 | A_24_P276628 | 0.2956 | 0.3270 | |
| SRP007169 | PPT1 | 5538 | RNAseq | 1.8303 | 0.0001 | |
| SRP008496 | PPT1 | 5538 | RNAseq | 1.9549 | 0.0000 | |
| SRP064894 | PPT1 | 5538 | RNAseq | 1.2096 | 0.0000 | |
| SRP133303 | PPT1 | 5538 | RNAseq | 0.9751 | 0.0000 | |
| SRP159526 | PPT1 | 5538 | RNAseq | 2.1326 | 0.0000 | |
| SRP193095 | PPT1 | 5538 | RNAseq | 1.0765 | 0.0000 | |
| SRP219564 | PPT1 | 5538 | RNAseq | 1.0662 | 0.0410 | |
| TCGA | PPT1 | 5538 | RNAseq | 0.2718 | 0.0000 |
Upregulated datasets: 14; Downregulated datasets: 0.
Survival by PPT1 expression:
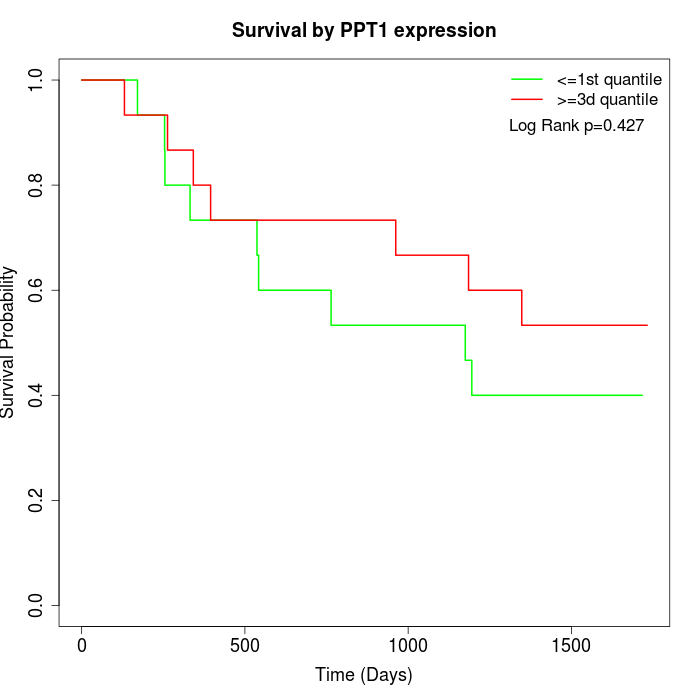 | 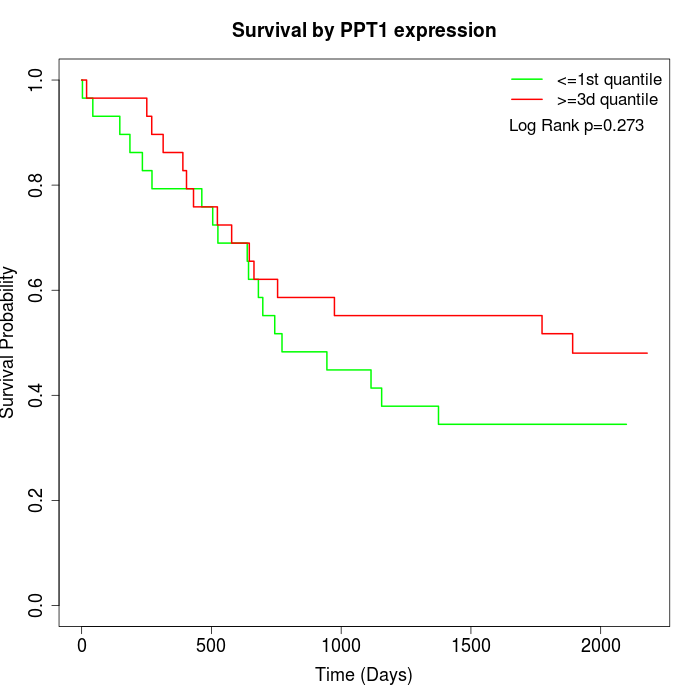 | 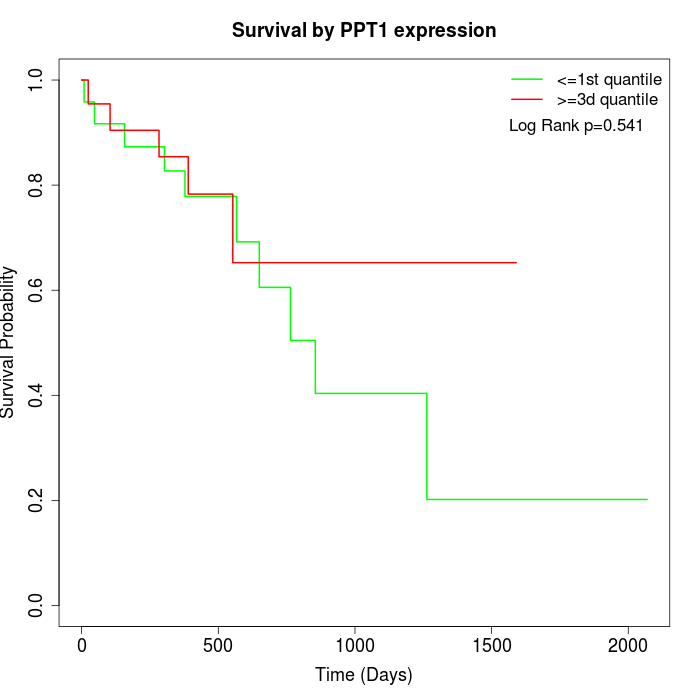 |
| GSE53622 | GSE53624 | TCGA |
Note: Click image to view full size file.
Copy number change of PPT1:
| Dataset | Gene | EntrezID | Gain | Loss | Normal | Detail |
|---|---|---|---|---|---|---|
| GSE15526 | PPT1 | 5538 | 3 | 4 | 23 | |
| GSE20123 | PPT1 | 5538 | 2 | 3 | 25 | |
| GSE43470 | PPT1 | 5538 | 7 | 2 | 34 | |
| GSE46452 | PPT1 | 5538 | 4 | 1 | 54 | |
| GSE47630 | PPT1 | 5538 | 9 | 2 | 29 | |
| GSE54993 | PPT1 | 5538 | 0 | 1 | 69 | |
| GSE54994 | PPT1 | 5538 | 13 | 2 | 38 | |
| GSE60625 | PPT1 | 5538 | 0 | 0 | 11 | |
| GSE74703 | PPT1 | 5538 | 6 | 1 | 29 | |
| GSE74704 | PPT1 | 5538 | 1 | 0 | 19 | |
| TCGA | PPT1 | 5538 | 16 | 16 | 64 |
Total number of gains: 61; Total number of losses: 32; Total Number of normals: 395.
Somatic mutations of PPT1:
Generating mutation plots.
Highly correlated genes for PPT1:
Showing top 20/1932 corelated genes with mean PCC>0.5.
| Gene1 | Gene2 | Mean PCC | Num. Datasets | Num. PCC<0 | Num. PCC>0.5 |
|---|---|---|---|---|---|
| PPT1 | FCGR3A | 0.781043 | 3 | 0 | 3 |
| PPT1 | C14orf119 | 0.764815 | 3 | 0 | 3 |
| PPT1 | GNG10 | 0.763243 | 3 | 0 | 3 |
| PPT1 | WDR54 | 0.761126 | 7 | 0 | 7 |
| PPT1 | PSMB4 | 0.759517 | 11 | 0 | 10 |
| PPT1 | MORC2 | 0.749951 | 9 | 0 | 9 |
| PPT1 | HLTF | 0.747523 | 12 | 0 | 11 |
| PPT1 | SLC35B2 | 0.747379 | 3 | 0 | 3 |
| PPT1 | FXR1 | 0.746004 | 10 | 0 | 9 |
| PPT1 | CRTC2 | 0.744713 | 3 | 0 | 3 |
| PPT1 | BID | 0.743265 | 10 | 0 | 10 |
| PPT1 | SLC39A14 | 0.739333 | 11 | 0 | 11 |
| PPT1 | CEP120 | 0.737447 | 3 | 0 | 3 |
| PPT1 | MSH6 | 0.735127 | 13 | 0 | 12 |
| PPT1 | TBL1XR1 | 0.734303 | 11 | 0 | 11 |
| PPT1 | RNPS1 | 0.734003 | 10 | 0 | 10 |
| PPT1 | BOD1 | 0.733673 | 7 | 0 | 7 |
| PPT1 | HNRNPLL | 0.732176 | 5 | 0 | 5 |
| PPT1 | MARCKSL1 | 0.731528 | 10 | 0 | 10 |
| PPT1 | ITGAV | 0.728466 | 11 | 0 | 11 |
For details and further investigation, click here