| Full name: proline rich membrane anchor 1 | Alias Symbol: PRIMA | ||
| Type: protein-coding gene | Cytoband: 14q32.12 | ||
| Entrez ID: 145270 | HGNC ID: HGNC:18319 | Ensembl Gene: ENSG00000175785 | OMIM ID: 613851 |
Expression of PRIMA1:
| Dataset | Gene | EntrezID | Probe | Log2FC | Adj.pValue | Expression |
|---|---|---|---|---|---|---|
| GSE17351 | PRIMA1 | 145270 | 230087_at | -1.5812 | 0.1323 | |
| GSE26886 | PRIMA1 | 145270 | 230087_at | 0.1300 | 0.7508 | |
| GSE45670 | PRIMA1 | 145270 | 230087_at | -1.2287 | 0.0001 | |
| GSE53622 | PRIMA1 | 145270 | 96951 | -1.3807 | 0.0000 | |
| GSE53624 | PRIMA1 | 145270 | 96951 | -1.1139 | 0.0000 | |
| GSE63941 | PRIMA1 | 145270 | 230087_at | 1.4514 | 0.0675 | |
| GSE77861 | PRIMA1 | 145270 | 230087_at | 0.1704 | 0.7315 | |
| GSE97050 | PRIMA1 | 145270 | A_23_P502808 | -0.4774 | 0.5017 | |
| SRP064894 | PRIMA1 | 145270 | RNAseq | -0.6343 | 0.1374 | |
| SRP133303 | PRIMA1 | 145270 | RNAseq | -0.6233 | 0.0713 | |
| SRP159526 | PRIMA1 | 145270 | RNAseq | -1.3005 | 0.0132 | |
| SRP219564 | PRIMA1 | 145270 | RNAseq | 0.4989 | 0.6094 | |
| TCGA | PRIMA1 | 145270 | RNAseq | -0.6627 | 0.0070 |
Upregulated datasets: 0; Downregulated datasets: 4.
Survival by PRIMA1 expression:
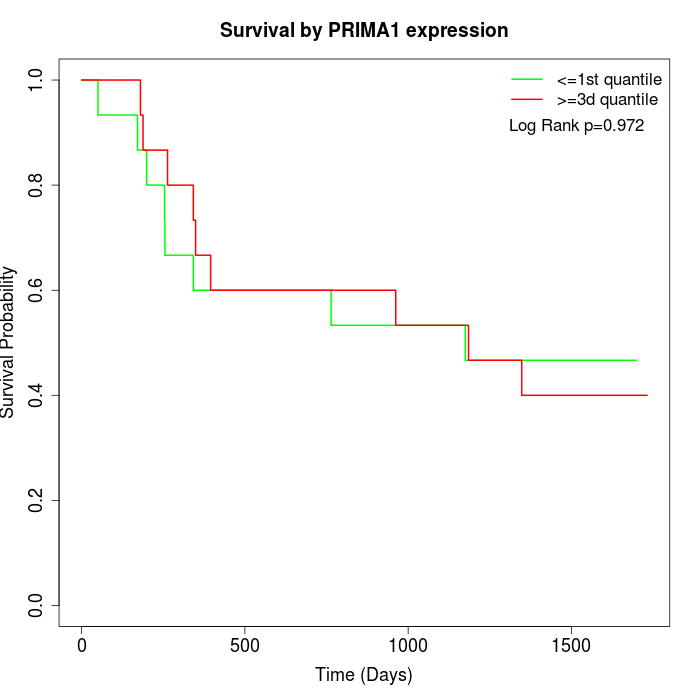 | 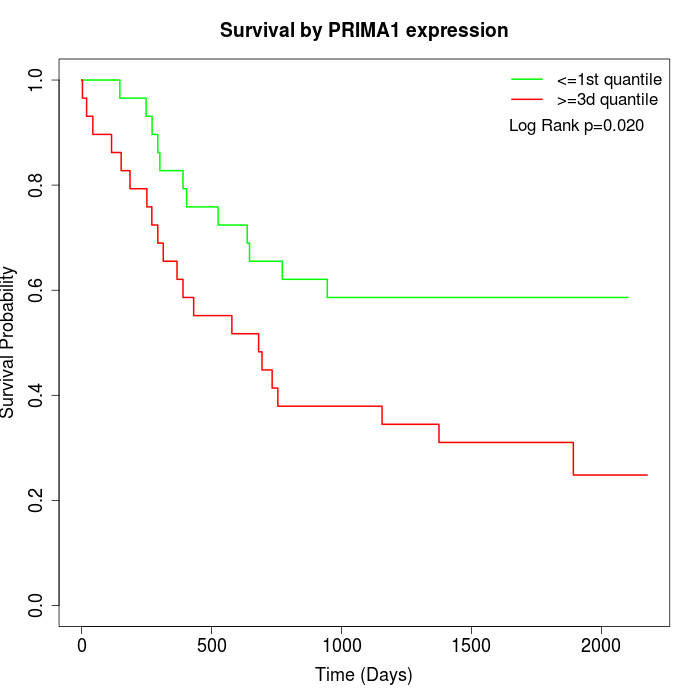 | 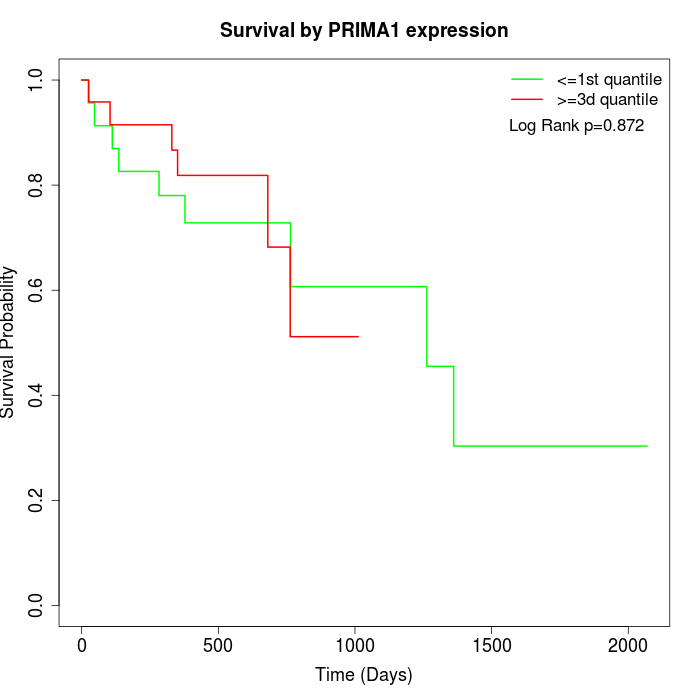 |
| GSE53622 | GSE53624 | TCGA |
Note: Click image to view full size file.
Copy number change of PRIMA1:
| Dataset | Gene | EntrezID | Gain | Loss | Normal | Detail |
|---|---|---|---|---|---|---|
| GSE15526 | PRIMA1 | 145270 | 8 | 4 | 18 | |
| GSE20123 | PRIMA1 | 145270 | 8 | 3 | 19 | |
| GSE43470 | PRIMA1 | 145270 | 7 | 3 | 33 | |
| GSE46452 | PRIMA1 | 145270 | 16 | 3 | 40 | |
| GSE47630 | PRIMA1 | 145270 | 11 | 8 | 21 | |
| GSE54993 | PRIMA1 | 145270 | 3 | 8 | 59 | |
| GSE54994 | PRIMA1 | 145270 | 20 | 4 | 29 | |
| GSE60625 | PRIMA1 | 145270 | 0 | 2 | 9 | |
| GSE74703 | PRIMA1 | 145270 | 6 | 3 | 27 | |
| GSE74704 | PRIMA1 | 145270 | 4 | 3 | 13 | |
| TCGA | PRIMA1 | 145270 | 29 | 21 | 46 |
Total number of gains: 112; Total number of losses: 62; Total Number of normals: 314.
Somatic mutations of PRIMA1:
Generating mutation plots.
Highly correlated genes for PRIMA1:
Showing top 20/342 corelated genes with mean PCC>0.5.
| Gene1 | Gene2 | Mean PCC | Num. Datasets | Num. PCC<0 | Num. PCC>0.5 |
|---|---|---|---|---|---|
| PRIMA1 | FXYD1 | 0.767015 | 3 | 0 | 3 |
| PRIMA1 | CHRDL1 | 0.761393 | 4 | 0 | 4 |
| PRIMA1 | C9orf47 | 0.759343 | 4 | 0 | 4 |
| PRIMA1 | MYOM1 | 0.754558 | 5 | 0 | 5 |
| PRIMA1 | ZER1 | 0.745789 | 3 | 0 | 3 |
| PRIMA1 | PLA2G5 | 0.730948 | 5 | 0 | 4 |
| PRIMA1 | MECP2 | 0.719734 | 3 | 0 | 3 |
| PRIMA1 | SLIT3 | 0.714966 | 3 | 0 | 3 |
| PRIMA1 | ATP1A2 | 0.699348 | 5 | 0 | 5 |
| PRIMA1 | CDH19 | 0.696524 | 6 | 0 | 6 |
| PRIMA1 | PGR | 0.695566 | 6 | 0 | 6 |
| PRIMA1 | SORCS1 | 0.695193 | 4 | 0 | 3 |
| PRIMA1 | KCNMB1 | 0.694716 | 5 | 0 | 4 |
| PRIMA1 | DCLK2 | 0.690506 | 3 | 0 | 3 |
| PRIMA1 | RASSF3 | 0.689343 | 4 | 0 | 4 |
| PRIMA1 | PER3 | 0.688853 | 3 | 0 | 3 |
| PRIMA1 | RBFOX3 | 0.687934 | 3 | 0 | 3 |
| PRIMA1 | RAB9B | 0.687182 | 5 | 0 | 5 |
| PRIMA1 | KCNH2 | 0.686819 | 4 | 0 | 3 |
| PRIMA1 | THRA | 0.684969 | 3 | 0 | 3 |
For details and further investigation, click here