| Full name: presenilin 1 | Alias Symbol: FAD|S182|PS1 | ||
| Type: protein-coding gene | Cytoband: 14q24.2 | ||
| Entrez ID: 5663 | HGNC ID: HGNC:9508 | Ensembl Gene: ENSG00000080815 | OMIM ID: 104311 |
| Related drugs: AVAGACESTAT, BEGACESTAT, CHEMBL2159511, CHEMBL2396778, CHEMBL247471, CHEMBL3186227, CHEMBL480558, NIROGACESTAT, PHORBOL MYRISTATE ACETATE, SEMAGACESTAT... [more] | |||
PSEN1 involved pathways:
| KEGG pathway | Description | View |
|---|---|---|
| hsa04310 | Wnt signaling pathway | |
| hsa04330 | Notch signaling pathway | |
| hsa05010 | Alzheimer's disease |
Expression of PSEN1:
| Dataset | Gene | EntrezID | Probe | Log2FC | Adj.pValue | Expression |
|---|---|---|---|---|---|---|
| GSE17351 | PSEN1 | 5663 | 203460_s_at | 0.1665 | 0.8060 | |
| GSE20347 | PSEN1 | 5663 | 203460_s_at | -0.2932 | 0.0247 | |
| GSE23400 | PSEN1 | 5663 | 203460_s_at | 0.3250 | 0.0001 | |
| GSE26886 | PSEN1 | 5663 | 203460_s_at | -0.2029 | 0.4227 | |
| GSE29001 | PSEN1 | 5663 | 203460_s_at | -0.0892 | 0.8166 | |
| GSE38129 | PSEN1 | 5663 | 203460_s_at | -0.0328 | 0.8420 | |
| GSE45670 | PSEN1 | 5663 | 203460_s_at | 0.2978 | 0.0193 | |
| GSE53622 | PSEN1 | 5663 | 65007 | 0.3283 | 0.0000 | |
| GSE53624 | PSEN1 | 5663 | 65007 | 0.1966 | 0.0001 | |
| GSE63941 | PSEN1 | 5663 | 203460_s_at | 0.4353 | 0.2416 | |
| GSE77861 | PSEN1 | 5663 | 203460_s_at | -0.1488 | 0.7194 | |
| GSE97050 | PSEN1 | 5663 | A_23_P106174 | 0.3066 | 0.1983 | |
| SRP007169 | PSEN1 | 5663 | RNAseq | -0.1771 | 0.5344 | |
| SRP008496 | PSEN1 | 5663 | RNAseq | -0.1862 | 0.3405 | |
| SRP064894 | PSEN1 | 5663 | RNAseq | 0.1868 | 0.1153 | |
| SRP133303 | PSEN1 | 5663 | RNAseq | 0.3578 | 0.0199 | |
| SRP159526 | PSEN1 | 5663 | RNAseq | -0.1415 | 0.5360 | |
| SRP193095 | PSEN1 | 5663 | RNAseq | -0.2141 | 0.0647 | |
| SRP219564 | PSEN1 | 5663 | RNAseq | -0.0148 | 0.9641 | |
| TCGA | PSEN1 | 5663 | RNAseq | -0.0074 | 0.8663 |
Upregulated datasets: 0; Downregulated datasets: 0.
Survival by PSEN1 expression:
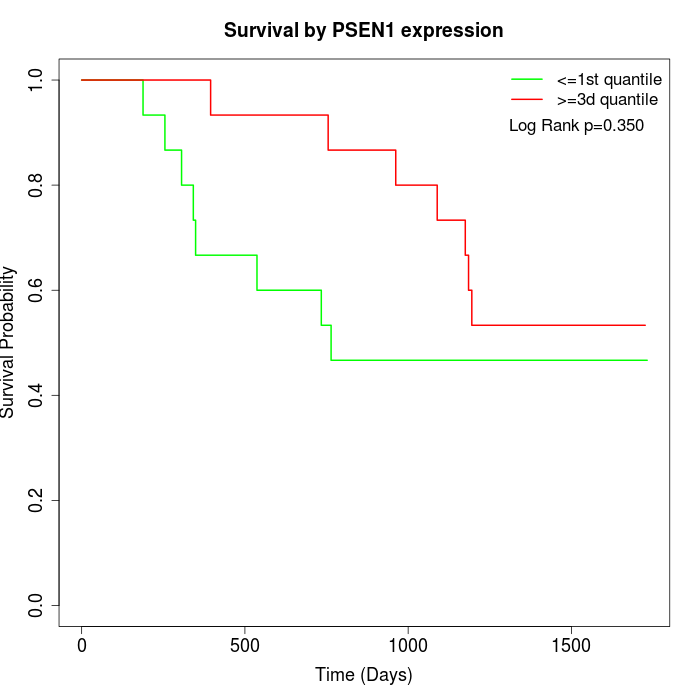 | 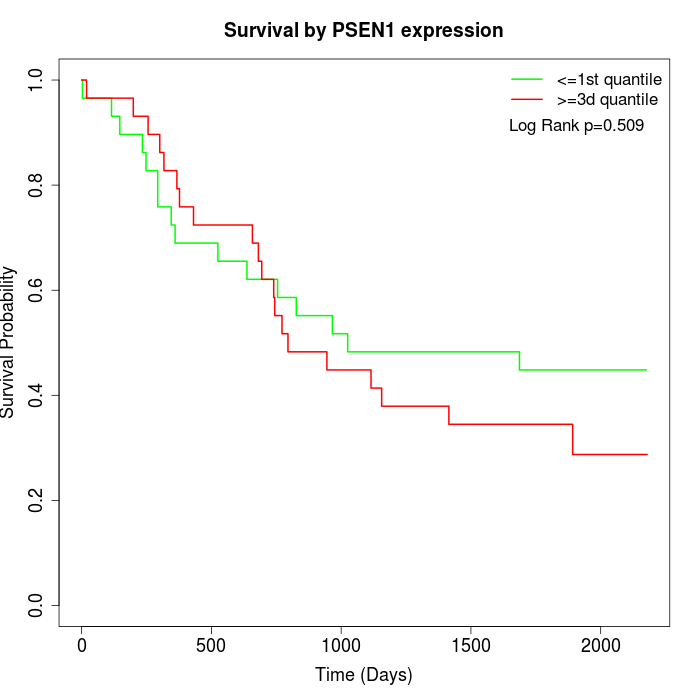 | 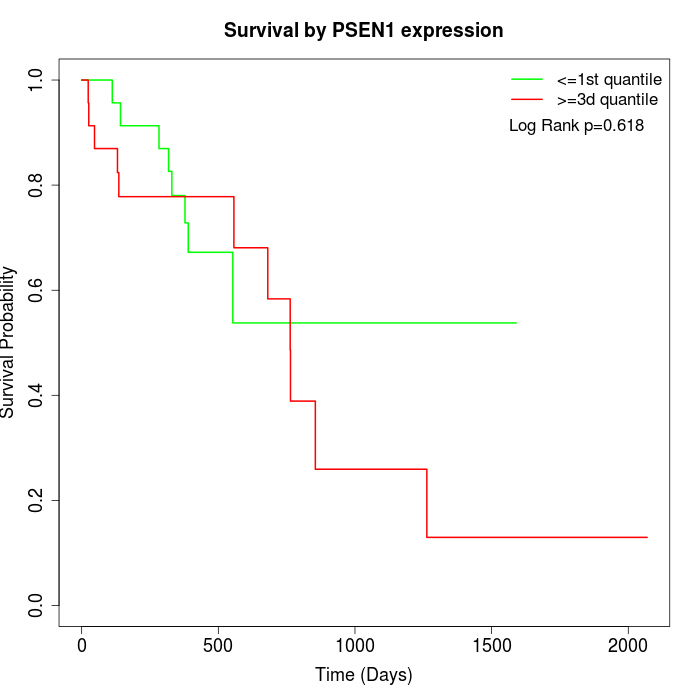 |
| GSE53622 | GSE53624 | TCGA |
Note: Click image to view full size file.
Copy number change of PSEN1:
| Dataset | Gene | EntrezID | Gain | Loss | Normal | Detail |
|---|---|---|---|---|---|---|
| GSE15526 | PSEN1 | 5663 | 8 | 2 | 20 | |
| GSE20123 | PSEN1 | 5663 | 8 | 2 | 20 | |
| GSE43470 | PSEN1 | 5663 | 8 | 3 | 32 | |
| GSE46452 | PSEN1 | 5663 | 16 | 3 | 40 | |
| GSE47630 | PSEN1 | 5663 | 11 | 8 | 21 | |
| GSE54993 | PSEN1 | 5663 | 3 | 8 | 59 | |
| GSE54994 | PSEN1 | 5663 | 19 | 4 | 30 | |
| GSE60625 | PSEN1 | 5663 | 0 | 2 | 9 | |
| GSE74703 | PSEN1 | 5663 | 7 | 3 | 26 | |
| GSE74704 | PSEN1 | 5663 | 3 | 2 | 15 | |
| TCGA | PSEN1 | 5663 | 31 | 17 | 48 |
Total number of gains: 114; Total number of losses: 54; Total Number of normals: 320.
Somatic mutations of PSEN1:
Generating mutation plots.
Highly correlated genes for PSEN1:
Showing top 20/580 corelated genes with mean PCC>0.5.
| Gene1 | Gene2 | Mean PCC | Num. Datasets | Num. PCC<0 | Num. PCC>0.5 |
|---|---|---|---|---|---|
| PSEN1 | DCP2 | 0.818096 | 3 | 0 | 3 |
| PSEN1 | C2orf76 | 0.799347 | 3 | 0 | 3 |
| PSEN1 | UHRF1BP1 | 0.793821 | 3 | 0 | 3 |
| PSEN1 | SNX4 | 0.789258 | 3 | 0 | 3 |
| PSEN1 | USP38 | 0.783939 | 3 | 0 | 3 |
| PSEN1 | PPHLN1 | 0.780627 | 3 | 0 | 3 |
| PSEN1 | RSRC2 | 0.758927 | 3 | 0 | 3 |
| PSEN1 | HSPA14 | 0.75492 | 3 | 0 | 3 |
| PSEN1 | YWHAB | 0.753437 | 3 | 0 | 3 |
| PSEN1 | RRAGC | 0.751338 | 3 | 0 | 3 |
| PSEN1 | FOXN3 | 0.748622 | 3 | 0 | 3 |
| PSEN1 | ZNF543 | 0.747401 | 3 | 0 | 3 |
| PSEN1 | HNRNPF | 0.745678 | 3 | 0 | 3 |
| PSEN1 | ATF1 | 0.744174 | 3 | 0 | 3 |
| PSEN1 | CCNK | 0.740974 | 4 | 0 | 4 |
| PSEN1 | NAA25 | 0.737675 | 3 | 0 | 3 |
| PSEN1 | GFM2 | 0.736337 | 3 | 0 | 3 |
| PSEN1 | CHMP4B | 0.73451 | 3 | 0 | 3 |
| PSEN1 | ZKSCAN1 | 0.728644 | 4 | 0 | 4 |
| PSEN1 | TRAPPC6B | 0.726852 | 5 | 0 | 3 |
For details and further investigation, click here