| Full name: pentatricopeptide repeat domain 3 | Alias Symbol: FLJ20758|DKFZp666K071 | ||
| Type: protein-coding gene | Cytoband: 2p11.2 | ||
| Entrez ID: 55037 | HGNC ID: HGNC:24717 | Ensembl Gene: ENSG00000132300 | OMIM ID: 614918 |
Screen Evidence:
| |||
Expression of PTCD3:
| Dataset | Gene | EntrezID | Probe | Log2FC | Adj.pValue | Expression |
|---|---|---|---|---|---|---|
| GSE17351 | PTCD3 | 55037 | 217895_at | 0.4189 | 0.0591 | |
| GSE20347 | PTCD3 | 55037 | 217895_at | 0.6394 | 0.0000 | |
| GSE23400 | PTCD3 | 55037 | 217895_at | 0.5286 | 0.0000 | |
| GSE26886 | PTCD3 | 55037 | 217895_at | 0.1050 | 0.5579 | |
| GSE29001 | PTCD3 | 55037 | 217895_at | 0.2707 | 0.2539 | |
| GSE38129 | PTCD3 | 55037 | 217895_at | 0.5810 | 0.0000 | |
| GSE45670 | PTCD3 | 55037 | 217895_at | 0.5555 | 0.0054 | |
| GSE53622 | PTCD3 | 55037 | 39956 | 0.4842 | 0.0000 | |
| GSE53624 | PTCD3 | 55037 | 39956 | 0.5571 | 0.0000 | |
| GSE63941 | PTCD3 | 55037 | 217895_at | 0.4871 | 0.2099 | |
| GSE77861 | PTCD3 | 55037 | 217895_at | 0.6472 | 0.0321 | |
| GSE97050 | PTCD3 | 55037 | A_33_P3290945 | 0.4023 | 0.1862 | |
| SRP007169 | PTCD3 | 55037 | RNAseq | 0.5810 | 0.0914 | |
| SRP008496 | PTCD3 | 55037 | RNAseq | 0.6485 | 0.0080 | |
| SRP064894 | PTCD3 | 55037 | RNAseq | 0.2477 | 0.1319 | |
| SRP133303 | PTCD3 | 55037 | RNAseq | 0.3146 | 0.0014 | |
| SRP159526 | PTCD3 | 55037 | RNAseq | 0.5360 | 0.0112 | |
| SRP193095 | PTCD3 | 55037 | RNAseq | 0.1306 | 0.1162 | |
| SRP219564 | PTCD3 | 55037 | RNAseq | 0.2370 | 0.5459 | |
| TCGA | PTCD3 | 55037 | RNAseq | 0.0229 | 0.6288 |
Upregulated datasets: 0; Downregulated datasets: 0.
Survival by PTCD3 expression:
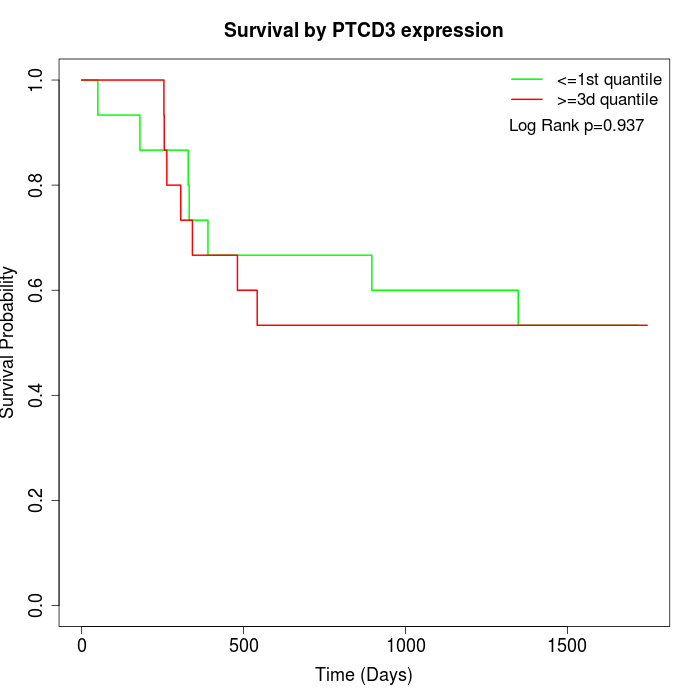 | 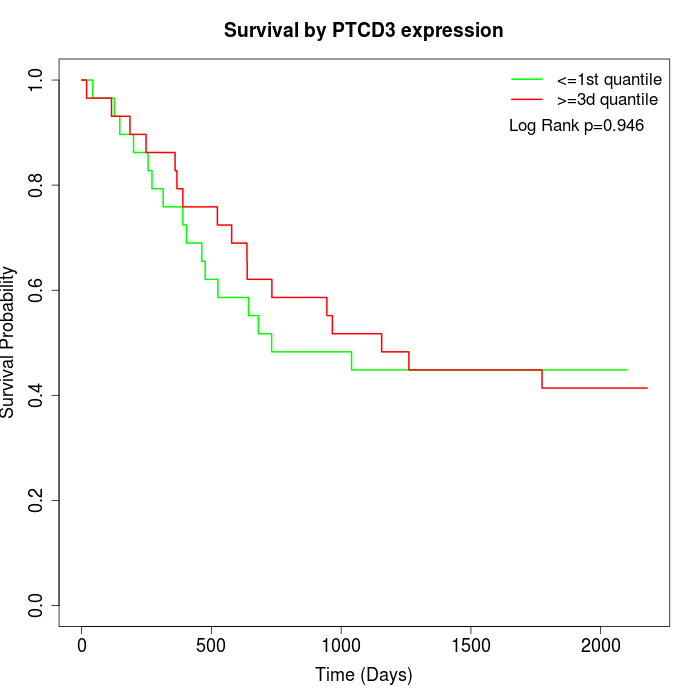 | 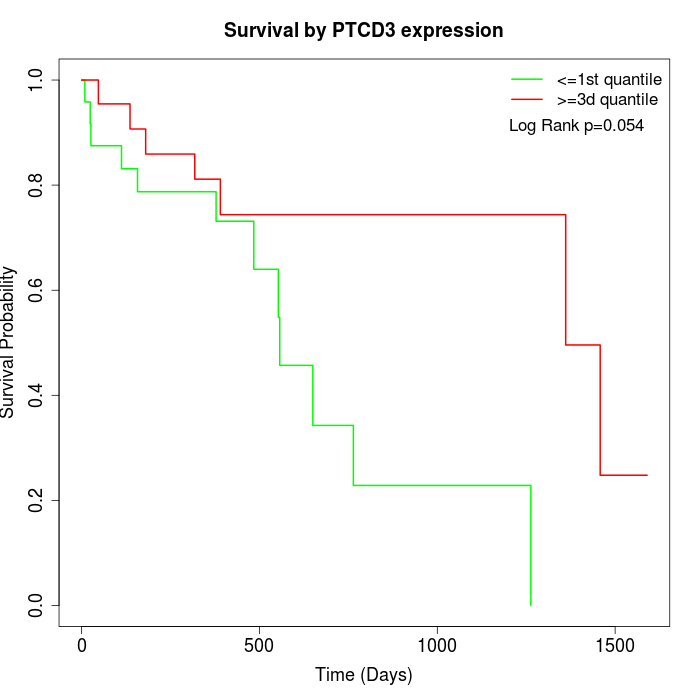 |
| GSE53622 | GSE53624 | TCGA |
Note: Click image to view full size file.
Copy number change of PTCD3:
| Dataset | Gene | EntrezID | Gain | Loss | Normal | Detail |
|---|---|---|---|---|---|---|
| GSE15526 | PTCD3 | 55037 | 9 | 2 | 19 | |
| GSE20123 | PTCD3 | 55037 | 9 | 2 | 19 | |
| GSE43470 | PTCD3 | 55037 | 4 | 2 | 37 | |
| GSE46452 | PTCD3 | 55037 | 2 | 3 | 54 | |
| GSE47630 | PTCD3 | 55037 | 7 | 0 | 33 | |
| GSE54993 | PTCD3 | 55037 | 0 | 6 | 64 | |
| GSE54994 | PTCD3 | 55037 | 10 | 0 | 43 | |
| GSE60625 | PTCD3 | 55037 | 0 | 3 | 8 | |
| GSE74703 | PTCD3 | 55037 | 4 | 1 | 31 | |
| GSE74704 | PTCD3 | 55037 | 7 | 0 | 13 | |
| TCGA | PTCD3 | 55037 | 35 | 4 | 57 |
Total number of gains: 87; Total number of losses: 23; Total Number of normals: 378.
Somatic mutations of PTCD3:
Generating mutation plots.
Highly correlated genes for PTCD3:
Showing top 20/1687 corelated genes with mean PCC>0.5.
| Gene1 | Gene2 | Mean PCC | Num. Datasets | Num. PCC<0 | Num. PCC>0.5 |
|---|---|---|---|---|---|
| PTCD3 | PHF5A | 0.758975 | 4 | 0 | 4 |
| PTCD3 | NUDCD1 | 0.757539 | 4 | 0 | 4 |
| PTCD3 | IGFBP4 | 0.746918 | 3 | 0 | 3 |
| PTCD3 | ZNF778 | 0.746024 | 3 | 0 | 3 |
| PTCD3 | PXN | 0.744594 | 4 | 0 | 4 |
| PTCD3 | CEP41 | 0.737204 | 3 | 0 | 3 |
| PTCD3 | IL1B | 0.728283 | 4 | 0 | 4 |
| PTCD3 | RNF181 | 0.725437 | 3 | 0 | 3 |
| PTCD3 | RTTN | 0.7185 | 3 | 0 | 3 |
| PTCD3 | MBNL1 | 0.716057 | 3 | 0 | 3 |
| PTCD3 | CDCA2 | 0.714274 | 5 | 0 | 4 |
| PTCD3 | U2SURP | 0.712762 | 8 | 0 | 8 |
| PTCD3 | USP39 | 0.711343 | 11 | 0 | 10 |
| PTCD3 | SIX4 | 0.711225 | 6 | 0 | 6 |
| PTCD3 | HAS3 | 0.706418 | 4 | 0 | 4 |
| PTCD3 | TMC7 | 0.706064 | 3 | 0 | 3 |
| PTCD3 | MPV17 | 0.705689 | 6 | 0 | 6 |
| PTCD3 | ZNF664 | 0.705344 | 3 | 0 | 3 |
| PTCD3 | XPO1 | 0.703911 | 12 | 0 | 11 |
| PTCD3 | IMMT | 0.703777 | 11 | 0 | 9 |
For details and further investigation, click here