| Full name: prostaglandin I2 receptor | Alias Symbol: IP | ||
| Type: protein-coding gene | Cytoband: 19q13.32 | ||
| Entrez ID: 5739 | HGNC ID: HGNC:9602 | Ensembl Gene: ENSG00000160013 | OMIM ID: 600022 |
| Related drugs: BERAPROST, DINOPROST TROMETHAMINE, EPOPROSTENOL, EPOPROSTENOL SODIUM, ESUBERAPROST, ILOPROST, MISOPROSTOL, RALINEPAG, SELEXIPAG, TREPROSTINIL... [more] | |||
PTGIR involved pathways:
| KEGG pathway | Description | View |
|---|---|---|
| hsa04270 | Vascular smooth muscle contraction | |
| hsa04611 | Platelet activation |
Expression of PTGIR:
| Dataset | Gene | EntrezID | Probe | Log2FC | Adj.pValue | Expression |
|---|---|---|---|---|---|---|
| GSE17351 | PTGIR | 5739 | 1555620_a_at | 0.0842 | 0.7513 | |
| GSE20347 | PTGIR | 5739 | 206187_at | 0.0918 | 0.2476 | |
| GSE23400 | PTGIR | 5739 | 206187_at | 0.0442 | 0.1460 | |
| GSE26886 | PTGIR | 5739 | 1555620_a_at | 0.0045 | 0.9748 | |
| GSE29001 | PTGIR | 5739 | 206187_at | -0.0858 | 0.5833 | |
| GSE38129 | PTGIR | 5739 | 206187_at | -0.1390 | 0.2078 | |
| GSE45670 | PTGIR | 5739 | 1555620_a_at | 0.1172 | 0.1245 | |
| GSE53622 | PTGIR | 5739 | 26538 | 0.1492 | 0.0676 | |
| GSE53624 | PTGIR | 5739 | 26538 | 0.2631 | 0.0016 | |
| GSE63941 | PTGIR | 5739 | 1555620_a_at | 0.3653 | 0.0123 | |
| GSE77861 | PTGIR | 5739 | 1555620_a_at | -0.0034 | 0.9774 | |
| GSE97050 | PTGIR | 5739 | A_23_P340848 | 0.0900 | 0.7279 | |
| SRP007169 | PTGIR | 5739 | RNAseq | 3.2122 | 0.0144 | |
| SRP064894 | PTGIR | 5739 | RNAseq | 0.6741 | 0.0178 | |
| SRP133303 | PTGIR | 5739 | RNAseq | 0.8171 | 0.0022 | |
| SRP159526 | PTGIR | 5739 | RNAseq | 0.5130 | 0.2787 | |
| SRP219564 | PTGIR | 5739 | RNAseq | 0.4956 | 0.4337 | |
| TCGA | PTGIR | 5739 | RNAseq | 0.2368 | 0.2401 |
Upregulated datasets: 1; Downregulated datasets: 0.
Survival by PTGIR expression:
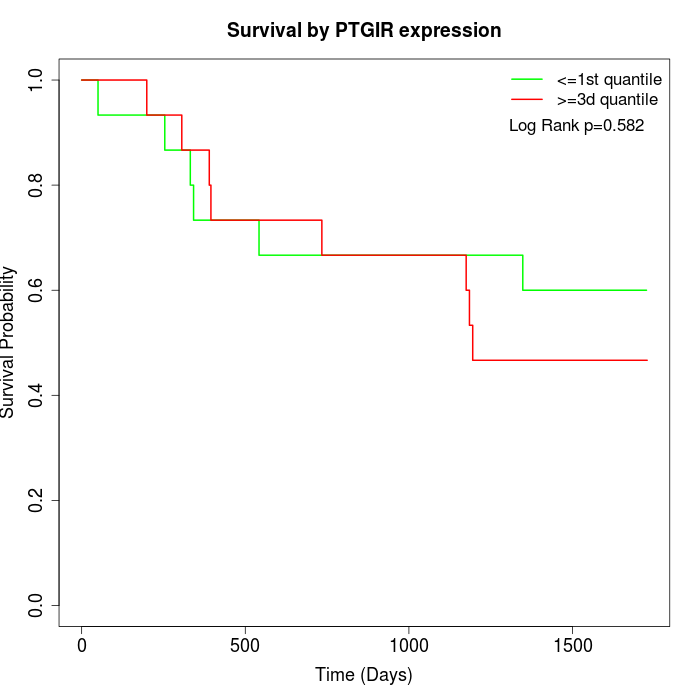 | 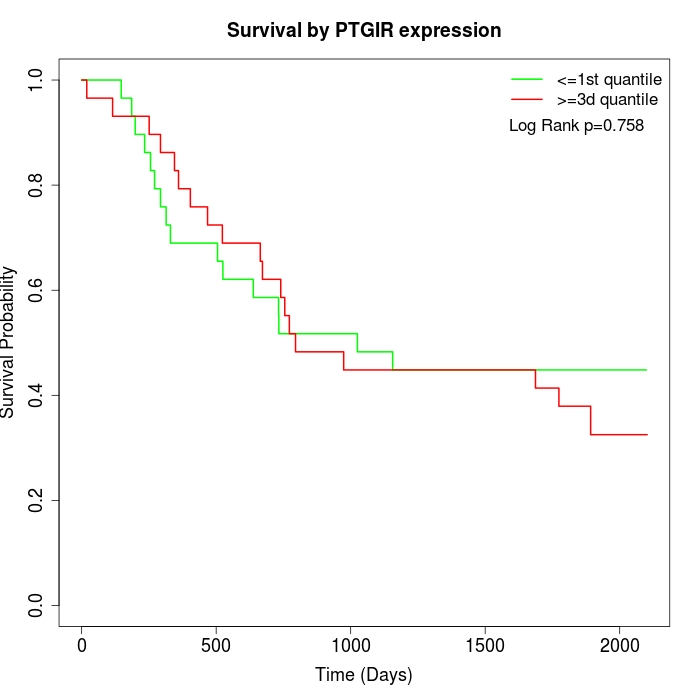 | 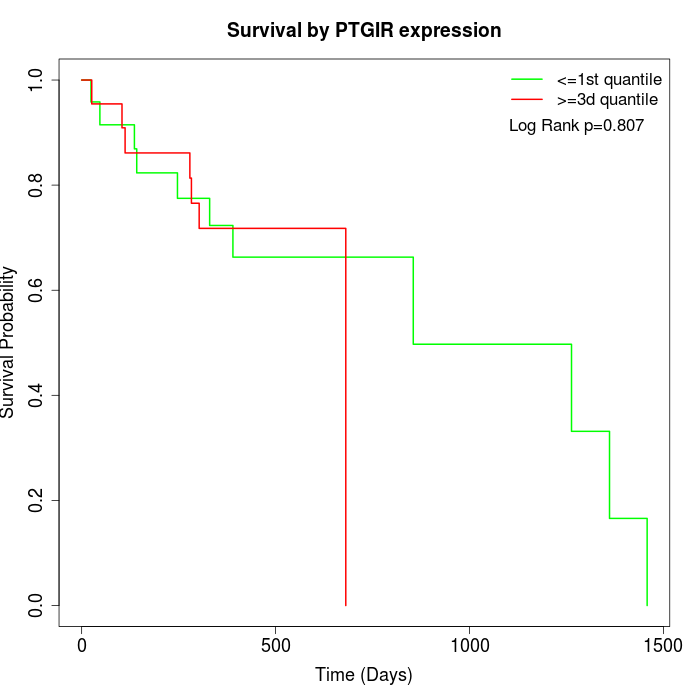 |
| GSE53622 | GSE53624 | TCGA |
Note: Click image to view full size file.
Copy number change of PTGIR:
| Dataset | Gene | EntrezID | Gain | Loss | Normal | Detail |
|---|---|---|---|---|---|---|
| GSE15526 | PTGIR | 5739 | 4 | 4 | 22 | |
| GSE20123 | PTGIR | 5739 | 4 | 3 | 23 | |
| GSE43470 | PTGIR | 5739 | 3 | 11 | 29 | |
| GSE46452 | PTGIR | 5739 | 45 | 1 | 13 | |
| GSE47630 | PTGIR | 5739 | 8 | 7 | 25 | |
| GSE54993 | PTGIR | 5739 | 17 | 4 | 49 | |
| GSE54994 | PTGIR | 5739 | 5 | 13 | 35 | |
| GSE60625 | PTGIR | 5739 | 9 | 0 | 2 | |
| GSE74703 | PTGIR | 5739 | 3 | 7 | 26 | |
| GSE74704 | PTGIR | 5739 | 4 | 1 | 15 | |
| TCGA | PTGIR | 5739 | 14 | 16 | 66 |
Total number of gains: 116; Total number of losses: 67; Total Number of normals: 305.
Somatic mutations of PTGIR:
Generating mutation plots.
Highly correlated genes for PTGIR:
Showing top 20/660 corelated genes with mean PCC>0.5.
| Gene1 | Gene2 | Mean PCC | Num. Datasets | Num. PCC<0 | Num. PCC>0.5 |
|---|---|---|---|---|---|
| PTGIR | FMNL1 | 0.725837 | 4 | 0 | 4 |
| PTGIR | SYCN | 0.715683 | 3 | 0 | 3 |
| PTGIR | TTC9B | 0.709512 | 3 | 0 | 3 |
| PTGIR | C20orf141 | 0.697109 | 3 | 0 | 3 |
| PTGIR | ZSCAN10 | 0.695366 | 4 | 0 | 4 |
| PTGIR | TCTE3 | 0.692831 | 3 | 0 | 3 |
| PTGIR | NTRK1 | 0.688194 | 3 | 0 | 3 |
| PTGIR | CPAMD8 | 0.684713 | 3 | 0 | 3 |
| PTGIR | SIGIRR | 0.684203 | 3 | 0 | 3 |
| PTGIR | VWA3A | 0.682895 | 3 | 0 | 3 |
| PTGIR | RBM42 | 0.678768 | 3 | 0 | 3 |
| PTGIR | GJA4 | 0.678362 | 5 | 0 | 5 |
| PTGIR | TPBGL | 0.676616 | 4 | 0 | 4 |
| PTGIR | FES | 0.674518 | 4 | 0 | 3 |
| PTGIR | SCLY | 0.674337 | 3 | 0 | 3 |
| PTGIR | TAOK2 | 0.672786 | 4 | 0 | 3 |
| PTGIR | GPBAR1 | 0.668866 | 3 | 0 | 3 |
| PTGIR | RNF123 | 0.668594 | 4 | 0 | 4 |
| PTGIR | SYNGAP1 | 0.666257 | 4 | 0 | 4 |
| PTGIR | MOGAT2 | 0.663084 | 4 | 0 | 4 |
For details and further investigation, click here