| Full name: protein tyrosine phosphatase non-receptor type 5 | Alias Symbol: STEP|PTPSTEP|STEP61 | ||
| Type: protein-coding gene | Cytoband: 11p15.1 | ||
| Entrez ID: 84867 | HGNC ID: HGNC:9657 | Ensembl Gene: ENSG00000110786 | OMIM ID: 176879 |
PTPN5 involved pathways:
| KEGG pathway | Description | View |
|---|---|---|
| hsa04010 | MAPK signaling pathway |
Expression of PTPN5:
| Dataset | Gene | EntrezID | Probe | Log2FC | Adj.pValue | Expression |
|---|---|---|---|---|---|---|
| GSE17351 | PTPN5 | 84867 | 236456_at | -0.2232 | 0.3470 | |
| GSE26886 | PTPN5 | 84867 | 233470_at | 0.0232 | 0.8494 | |
| GSE45670 | PTPN5 | 84867 | 233470_at | -0.0119 | 0.9216 | |
| GSE53622 | PTPN5 | 84867 | 124694 | -0.5924 | 0.0000 | |
| GSE53624 | PTPN5 | 84867 | 124694 | -0.6602 | 0.0000 | |
| GSE63941 | PTPN5 | 84867 | 233470_at | -0.1176 | 0.5082 | |
| GSE77861 | PTPN5 | 84867 | 233470_at | -0.2959 | 0.0270 | |
| SRP133303 | PTPN5 | 84867 | RNAseq | -1.0925 | 0.0430 | |
| SRP159526 | PTPN5 | 84867 | RNAseq | -0.1986 | 0.6752 | |
| SRP219564 | PTPN5 | 84867 | RNAseq | 0.0370 | 0.9637 | |
| TCGA | PTPN5 | 84867 | RNAseq | -2.1165 | 0.0003 |
Upregulated datasets: 0; Downregulated datasets: 2.
Survival by PTPN5 expression:
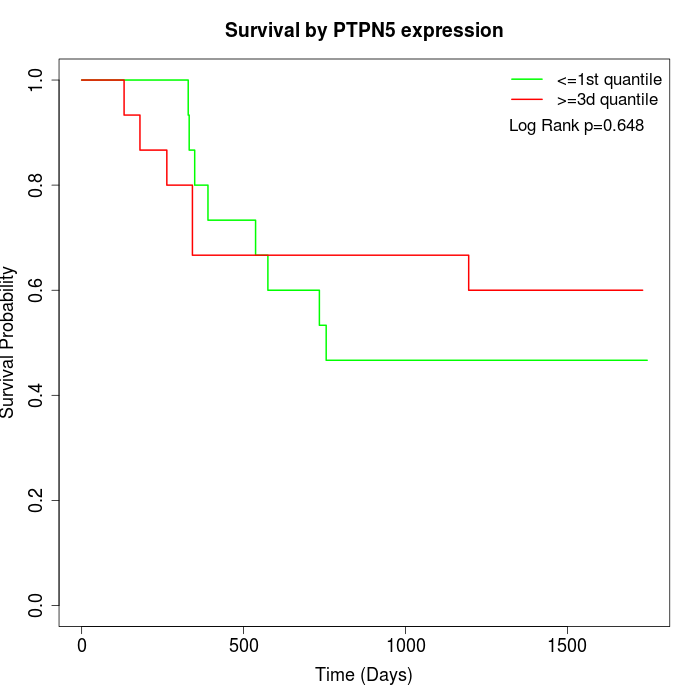 | 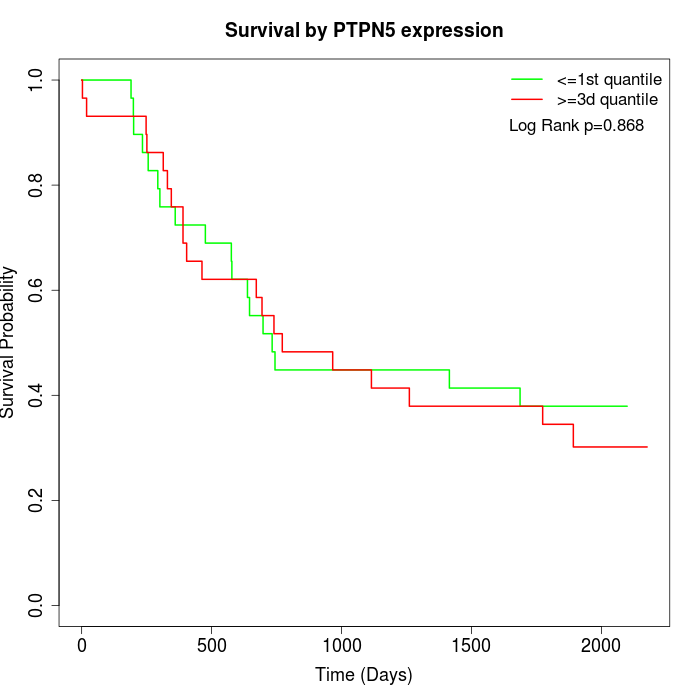 | 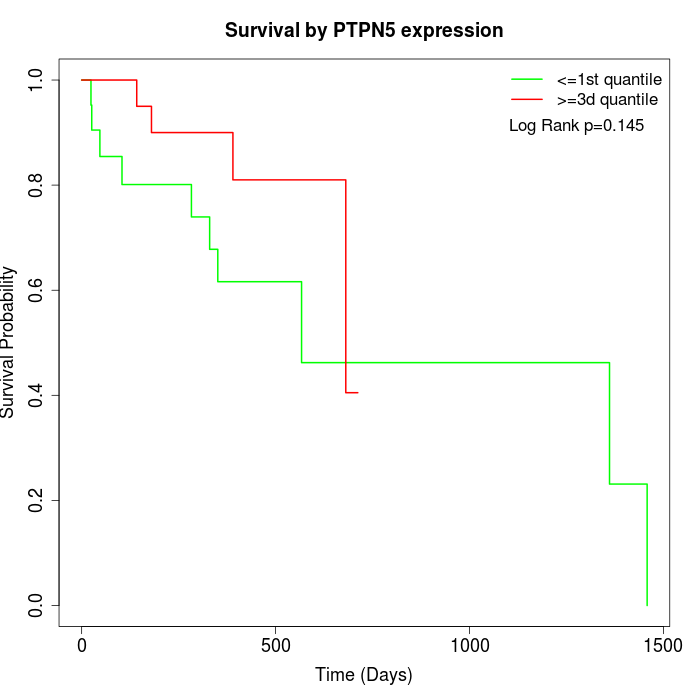 |
| GSE53622 | GSE53624 | TCGA |
Note: Click image to view full size file.
Copy number change of PTPN5:
| Dataset | Gene | EntrezID | Gain | Loss | Normal | Detail |
|---|---|---|---|---|---|---|
| GSE15526 | PTPN5 | 84867 | 0 | 10 | 20 | |
| GSE20123 | PTPN5 | 84867 | 0 | 10 | 20 | |
| GSE43470 | PTPN5 | 84867 | 1 | 5 | 37 | |
| GSE46452 | PTPN5 | 84867 | 7 | 5 | 47 | |
| GSE47630 | PTPN5 | 84867 | 3 | 10 | 27 | |
| GSE54993 | PTPN5 | 84867 | 3 | 0 | 67 | |
| GSE54994 | PTPN5 | 84867 | 3 | 12 | 38 | |
| GSE60625 | PTPN5 | 84867 | 0 | 0 | 11 | |
| GSE74703 | PTPN5 | 84867 | 1 | 3 | 32 | |
| GSE74704 | PTPN5 | 84867 | 0 | 9 | 11 | |
| TCGA | PTPN5 | 84867 | 11 | 29 | 56 |
Total number of gains: 29; Total number of losses: 93; Total Number of normals: 366.
Somatic mutations of PTPN5:
Generating mutation plots.
Highly correlated genes for PTPN5:
Showing top 20/101 corelated genes with mean PCC>0.5.
| Gene1 | Gene2 | Mean PCC | Num. Datasets | Num. PCC<0 | Num. PCC>0.5 |
|---|---|---|---|---|---|
| PTPN5 | LINC00922 | 0.721415 | 3 | 0 | 3 |
| PTPN5 | HTR1E | 0.684928 | 3 | 0 | 3 |
| PTPN5 | CYP3A43 | 0.6773 | 3 | 0 | 3 |
| PTPN5 | BFSP2 | 0.66482 | 3 | 0 | 3 |
| PTPN5 | PAX8 | 0.662102 | 3 | 0 | 3 |
| PTPN5 | TPSD1 | 0.658975 | 4 | 0 | 4 |
| PTPN5 | FTCDNL1 | 0.656986 | 3 | 0 | 3 |
| PTPN5 | LINC00092 | 0.647837 | 3 | 0 | 3 |
| PTPN5 | GATA6 | 0.64701 | 3 | 0 | 3 |
| PTPN5 | PKD2L1 | 0.636202 | 4 | 0 | 4 |
| PTPN5 | KANK3 | 0.634792 | 3 | 0 | 3 |
| PTPN5 | APOB | 0.627998 | 3 | 0 | 3 |
| PTPN5 | MYL4 | 0.627429 | 4 | 0 | 4 |
| PTPN5 | NHLRC4 | 0.627222 | 3 | 0 | 3 |
| PTPN5 | TSSK1B | 0.624368 | 4 | 0 | 4 |
| PTPN5 | ADCYAP1R1 | 0.623839 | 4 | 0 | 3 |
| PTPN5 | C20orf173 | 0.6231 | 4 | 0 | 3 |
| PTPN5 | HGFAC | 0.619251 | 3 | 0 | 3 |
| PTPN5 | PHF7 | 0.616481 | 3 | 0 | 3 |
| PTPN5 | OLFM1 | 0.61175 | 3 | 0 | 3 |
For details and further investigation, click here