| Full name: tryptase delta 1 | Alias Symbol: | ||
| Type: protein-coding gene | Cytoband: 16p13.3 | ||
| Entrez ID: 23430 | HGNC ID: HGNC:14118 | Ensembl Gene: ENSG00000095917 | OMIM ID: 609272 |
| Related drugs: CETIRIZINE, LANSOPRAZOLE... [more] | |||
Expression of TPSD1:
| Dataset | Gene | EntrezID | Probe | Log2FC | Adj.pValue | Expression |
|---|---|---|---|---|---|---|
| GSE17351 | TPSD1 | 23430 | 214568_at | -0.2610 | 0.2905 | |
| GSE20347 | TPSD1 | 23430 | 214568_at | -0.0944 | 0.1696 | |
| GSE23400 | TPSD1 | 23430 | 214568_at | -0.2243 | 0.0000 | |
| GSE26886 | TPSD1 | 23430 | 214568_at | 0.1706 | 0.1493 | |
| GSE29001 | TPSD1 | 23430 | 214568_at | -0.1595 | 0.2783 | |
| GSE38129 | TPSD1 | 23430 | 214568_at | -0.1766 | 0.0215 | |
| GSE45670 | TPSD1 | 23430 | 214568_at | 0.0118 | 0.9310 | |
| GSE53622 | TPSD1 | 23430 | 23715 | -1.6917 | 0.0000 | |
| GSE53624 | TPSD1 | 23430 | 23715 | -1.6634 | 0.0000 | |
| GSE63941 | TPSD1 | 23430 | 214568_at | 0.1397 | 0.4127 | |
| GSE77861 | TPSD1 | 23430 | 214568_at | -0.1346 | 0.1752 | |
| GSE97050 | TPSD1 | 23430 | A_33_P3382324 | -0.5263 | 0.3042 | |
| SRP133303 | TPSD1 | 23430 | RNAseq | -1.6814 | 0.0063 | |
| SRP159526 | TPSD1 | 23430 | RNAseq | -0.7065 | 0.4492 | |
| SRP219564 | TPSD1 | 23430 | RNAseq | -1.4072 | 0.0327 | |
| TCGA | TPSD1 | 23430 | RNAseq | -0.9402 | 0.1266 |
Upregulated datasets: 0; Downregulated datasets: 4.
Survival by TPSD1 expression:
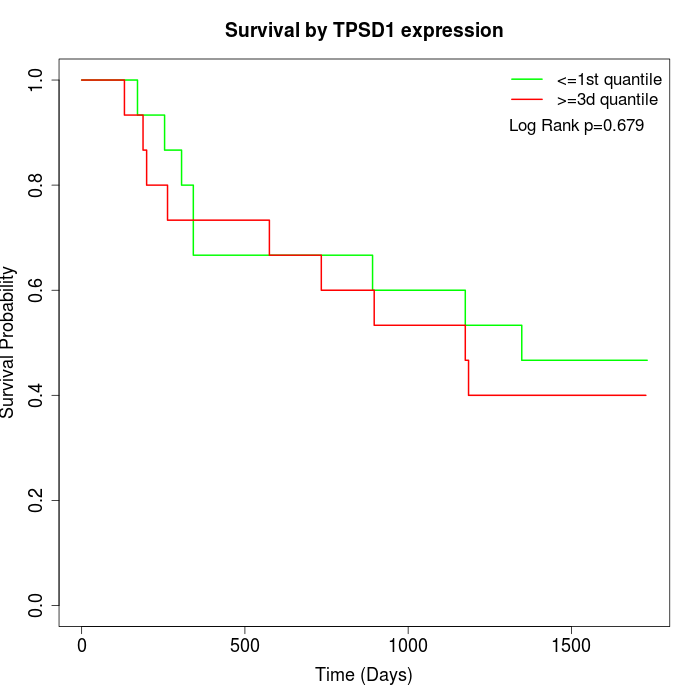 | 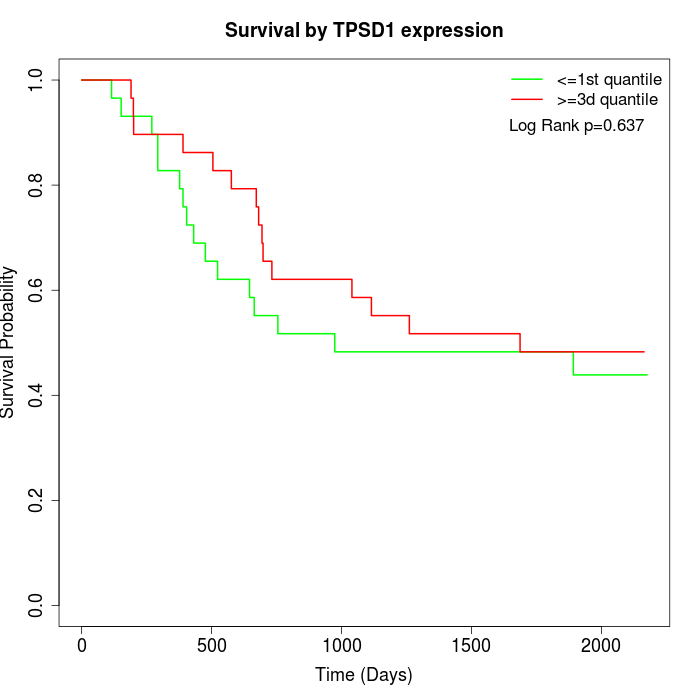 | 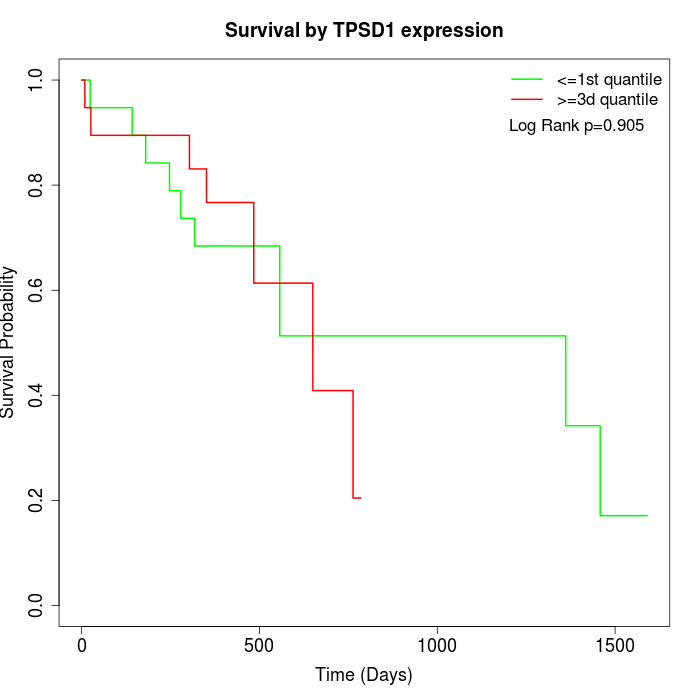 |
| GSE53622 | GSE53624 | TCGA |
Note: Click image to view full size file.
Copy number change of TPSD1:
| Dataset | Gene | EntrezID | Gain | Loss | Normal | Detail |
|---|---|---|---|---|---|---|
| GSE15526 | TPSD1 | 23430 | 5 | 5 | 20 | |
| GSE20123 | TPSD1 | 23430 | 5 | 4 | 21 | |
| GSE43470 | TPSD1 | 23430 | 4 | 7 | 32 | |
| GSE46452 | TPSD1 | 23430 | 38 | 1 | 20 | |
| GSE47630 | TPSD1 | 23430 | 13 | 6 | 21 | |
| GSE54993 | TPSD1 | 23430 | 3 | 5 | 62 | |
| GSE54994 | TPSD1 | 23430 | 5 | 9 | 39 | |
| GSE60625 | TPSD1 | 23430 | 4 | 0 | 7 | |
| GSE74703 | TPSD1 | 23430 | 4 | 5 | 27 | |
| GSE74704 | TPSD1 | 23430 | 3 | 2 | 15 | |
| TCGA | TPSD1 | 23430 | 19 | 14 | 63 |
Total number of gains: 103; Total number of losses: 58; Total Number of normals: 327.
Somatic mutations of TPSD1:
Generating mutation plots.
Highly correlated genes for TPSD1:
Showing top 20/903 corelated genes with mean PCC>0.5.
| Gene1 | Gene2 | Mean PCC | Num. Datasets | Num. PCC<0 | Num. PCC>0.5 |
|---|---|---|---|---|---|
| TPSD1 | CYYR1 | 0.770129 | 4 | 0 | 4 |
| TPSD1 | TFPI | 0.740933 | 4 | 0 | 4 |
| TPSD1 | GIMAP5 | 0.732964 | 3 | 0 | 3 |
| TPSD1 | CLEC3B | 0.729488 | 3 | 0 | 3 |
| TPSD1 | EBF1 | 0.728288 | 4 | 0 | 4 |
| TPSD1 | FBLN1 | 0.722306 | 4 | 0 | 4 |
| TPSD1 | GIMAP7 | 0.72029 | 3 | 0 | 3 |
| TPSD1 | CCL14 | 0.717752 | 3 | 0 | 3 |
| TPSD1 | VGF | 0.714637 | 4 | 0 | 4 |
| TPSD1 | PTPRB | 0.710136 | 4 | 0 | 4 |
| TPSD1 | OGN | 0.708135 | 4 | 0 | 4 |
| TPSD1 | NR2F1 | 0.70525 | 3 | 0 | 3 |
| TPSD1 | RSPO1 | 0.698123 | 5 | 0 | 5 |
| TPSD1 | NAGLU | 0.694654 | 3 | 0 | 3 |
| TPSD1 | GIMAP1 | 0.694045 | 4 | 0 | 4 |
| TPSD1 | ABCA6 | 0.682149 | 5 | 0 | 5 |
| TPSD1 | NPFF | 0.681219 | 3 | 0 | 3 |
| TPSD1 | RD3 | 0.680009 | 3 | 0 | 3 |
| TPSD1 | LYVE1 | 0.679474 | 6 | 0 | 6 |
| TPSD1 | HNF1A | 0.678575 | 8 | 0 | 8 |
For details and further investigation, click here