| Full name: protein tyrosine phosphatase receptor type R | Alias Symbol: PTPBR7|PTP-SL|EC-PTP|PCPTP1 | ||
| Type: protein-coding gene | Cytoband: 12q15 | ||
| Entrez ID: 5801 | HGNC ID: HGNC:9680 | Ensembl Gene: ENSG00000153233 | OMIM ID: 602853 |
PTPRR involved pathways:
| KEGG pathway | Description | View |
|---|---|---|
| hsa04010 | MAPK signaling pathway |
Expression of PTPRR:
| Dataset | Gene | EntrezID | Probe | Log2FC | Adj.pValue | Expression |
|---|---|---|---|---|---|---|
| GSE17351 | PTPRR | 5801 | 210675_s_at | 0.2715 | 0.7210 | |
| GSE20347 | PTPRR | 5801 | 210675_s_at | 0.0946 | 0.1213 | |
| GSE23400 | PTPRR | 5801 | 210675_s_at | 0.0021 | 0.9323 | |
| GSE26886 | PTPRR | 5801 | 206084_at | 0.4304 | 0.0046 | |
| GSE29001 | PTPRR | 5801 | 206084_at | 0.0524 | 0.7394 | |
| GSE38129 | PTPRR | 5801 | 210675_s_at | 0.1769 | 0.0787 | |
| GSE45670 | PTPRR | 5801 | 210675_s_at | 0.1141 | 0.6932 | |
| GSE53622 | PTPRR | 5801 | 27103 | -0.3322 | 0.0003 | |
| GSE53624 | PTPRR | 5801 | 27103 | 0.1176 | 0.2081 | |
| GSE63941 | PTPRR | 5801 | 206084_at | 1.6913 | 0.1989 | |
| GSE77861 | PTPRR | 5801 | 210675_s_at | 0.0157 | 0.8877 | |
| GSE97050 | PTPRR | 5801 | A_33_P3252800 | 0.2961 | 0.4483 | |
| TCGA | PTPRR | 5801 | RNAseq | -1.2039 | 0.0039 |
Upregulated datasets: 0; Downregulated datasets: 1.
Survival by PTPRR expression:
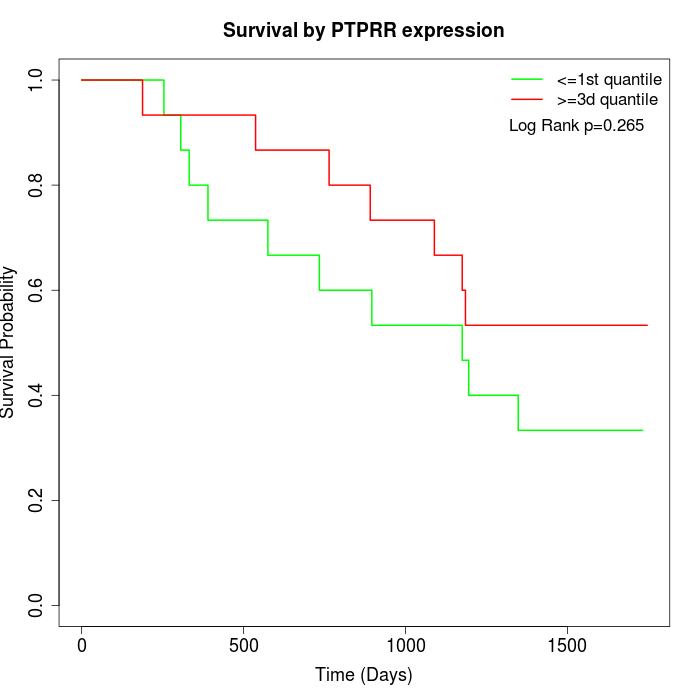 | 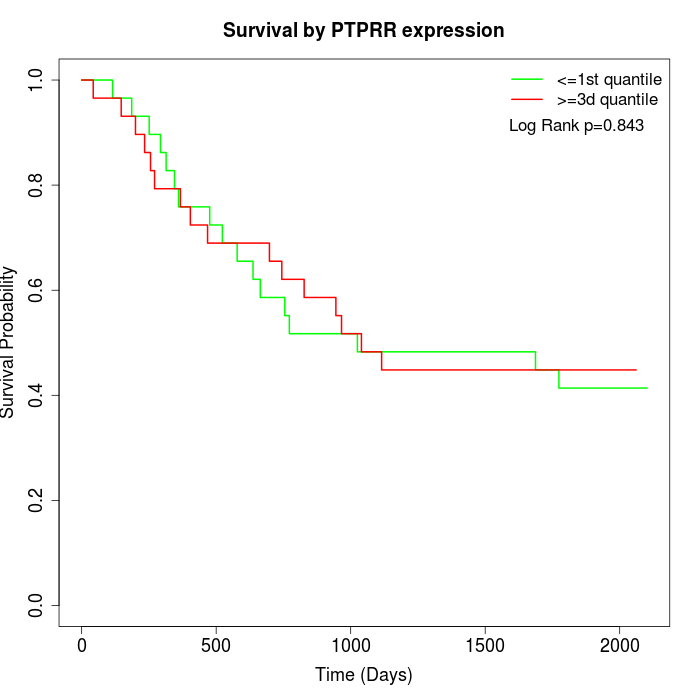 | 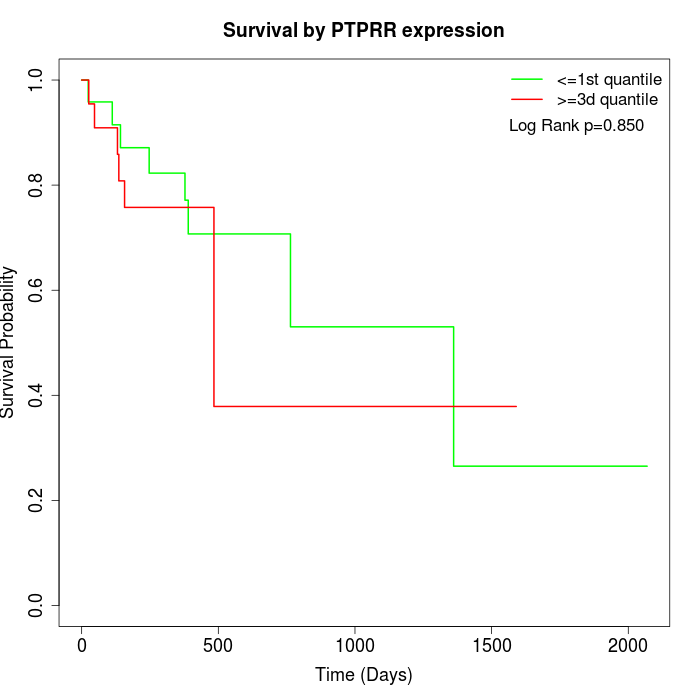 |
| GSE53622 | GSE53624 | TCGA |
Note: Click image to view full size file.
Copy number change of PTPRR:
| Dataset | Gene | EntrezID | Gain | Loss | Normal | Detail |
|---|---|---|---|---|---|---|
| GSE15526 | PTPRR | 5801 | 6 | 0 | 24 | |
| GSE20123 | PTPRR | 5801 | 6 | 0 | 24 | |
| GSE43470 | PTPRR | 5801 | 4 | 0 | 39 | |
| GSE46452 | PTPRR | 5801 | 9 | 1 | 49 | |
| GSE47630 | PTPRR | 5801 | 10 | 1 | 29 | |
| GSE54993 | PTPRR | 5801 | 0 | 5 | 65 | |
| GSE54994 | PTPRR | 5801 | 9 | 1 | 43 | |
| GSE60625 | PTPRR | 5801 | 0 | 0 | 11 | |
| GSE74703 | PTPRR | 5801 | 4 | 0 | 32 | |
| GSE74704 | PTPRR | 5801 | 5 | 0 | 15 | |
| TCGA | PTPRR | 5801 | 22 | 8 | 66 |
Total number of gains: 75; Total number of losses: 16; Total Number of normals: 397.
Somatic mutations of PTPRR:
Generating mutation plots.
Highly correlated genes for PTPRR:
Showing top 20/107 corelated genes with mean PCC>0.5.
| Gene1 | Gene2 | Mean PCC | Num. Datasets | Num. PCC<0 | Num. PCC>0.5 |
|---|---|---|---|---|---|
| PTPRR | ZNF559 | 0.750685 | 3 | 0 | 3 |
| PTPRR | PM20D1 | 0.723575 | 3 | 0 | 3 |
| PTPRR | MMP21 | 0.716148 | 3 | 0 | 3 |
| PTPRR | AGRP | 0.698606 | 3 | 0 | 3 |
| PTPRR | INPP5F | 0.691028 | 3 | 0 | 3 |
| PTPRR | RAB40B | 0.685405 | 3 | 0 | 3 |
| PTPRR | CLEC12B | 0.682726 | 4 | 0 | 3 |
| PTPRR | CNGB3 | 0.674591 | 4 | 0 | 4 |
| PTPRR | LRIT1 | 0.672305 | 4 | 0 | 3 |
| PTPRR | GDNF | 0.669448 | 3 | 0 | 3 |
| PTPRR | NKX2-8 | 0.667525 | 3 | 0 | 3 |
| PTPRR | PARS2 | 0.664167 | 4 | 0 | 3 |
| PTPRR | WDR90 | 0.657942 | 4 | 0 | 3 |
| PTPRR | TAS2R14 | 0.657895 | 3 | 0 | 3 |
| PTPRR | USP49 | 0.657093 | 5 | 0 | 3 |
| PTPRR | HOMER3 | 0.657062 | 3 | 0 | 3 |
| PTPRR | CHP2 | 0.652635 | 4 | 0 | 3 |
| PTPRR | MAGEL2 | 0.651102 | 4 | 0 | 3 |
| PTPRR | FAM24B | 0.650863 | 3 | 0 | 3 |
| PTPRR | HS2ST1 | 0.650769 | 3 | 0 | 3 |
For details and further investigation, click here