| Full name: protein tyrosine phosphatase receptor type U | Alias Symbol: PTPRO|hPTP-J|PCP-2|FMI|PTP | ||
| Type: protein-coding gene | Cytoband: 1p35.3 | ||
| Entrez ID: 10076 | HGNC ID: HGNC:9683 | Ensembl Gene: ENSG00000060656 | OMIM ID: 602454 |
Expression of PTPRU:
| Dataset | Gene | EntrezID | Probe | Log2FC | Adj.pValue | Expression |
|---|---|---|---|---|---|---|
| GSE17351 | PTPRU | 10076 | 211320_s_at | 0.0987 | 0.8118 | |
| GSE20347 | PTPRU | 10076 | 211320_s_at | -0.0248 | 0.8344 | |
| GSE23400 | PTPRU | 10076 | 211320_s_at | 0.0386 | 0.4298 | |
| GSE26886 | PTPRU | 10076 | 211320_s_at | 0.0154 | 0.9365 | |
| GSE29001 | PTPRU | 10076 | 211320_s_at | -0.1642 | 0.3414 | |
| GSE38129 | PTPRU | 10076 | 211320_s_at | -0.0316 | 0.7881 | |
| GSE45670 | PTPRU | 10076 | 211320_s_at | 0.1881 | 0.0388 | |
| GSE53622 | PTPRU | 10076 | 43100 | 0.2592 | 0.1536 | |
| GSE53624 | PTPRU | 10076 | 43100 | 0.5676 | 0.0000 | |
| GSE63941 | PTPRU | 10076 | 211320_s_at | 0.9427 | 0.0409 | |
| GSE77861 | PTPRU | 10076 | 211320_s_at | 0.0199 | 0.8692 | |
| GSE97050 | PTPRU | 10076 | A_23_P149064 | 0.3938 | 0.2416 | |
| SRP007169 | PTPRU | 10076 | RNAseq | 1.3258 | 0.0689 | |
| SRP008496 | PTPRU | 10076 | RNAseq | 1.0863 | 0.0383 | |
| SRP064894 | PTPRU | 10076 | RNAseq | 0.4458 | 0.0852 | |
| SRP133303 | PTPRU | 10076 | RNAseq | 0.3207 | 0.3276 | |
| SRP159526 | PTPRU | 10076 | RNAseq | 0.8633 | 0.1164 | |
| SRP193095 | PTPRU | 10076 | RNAseq | 1.7569 | 0.0000 | |
| SRP219564 | PTPRU | 10076 | RNAseq | 1.2363 | 0.0018 | |
| TCGA | PTPRU | 10076 | RNAseq | -0.0345 | 0.7694 |
Upregulated datasets: 3; Downregulated datasets: 0.
Survival by PTPRU expression:
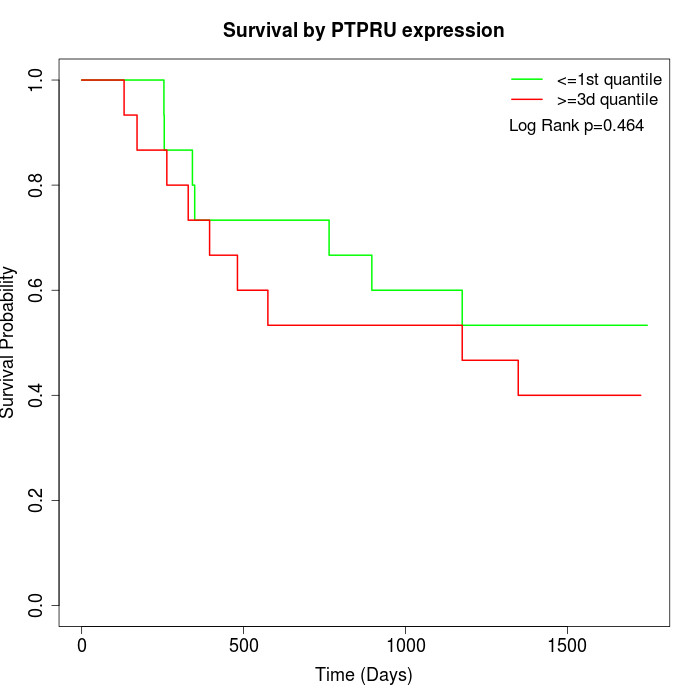 | 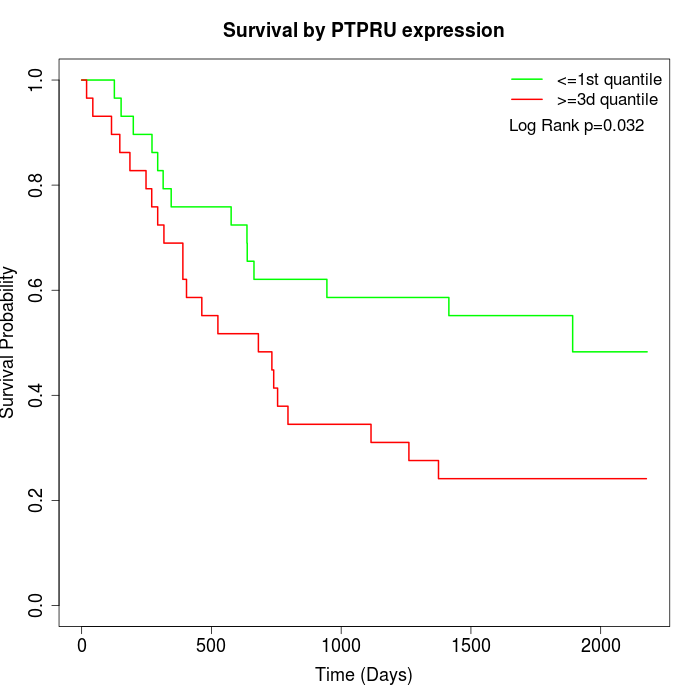 | 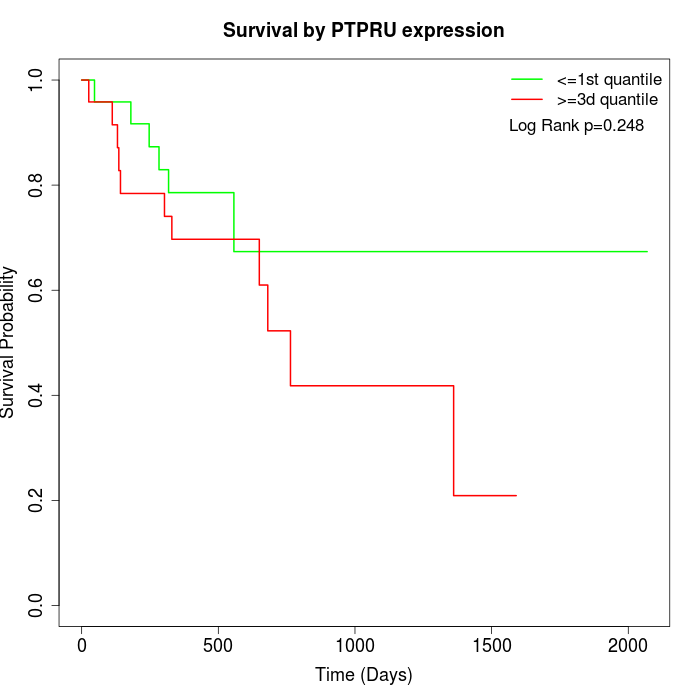 |
| GSE53622 | GSE53624 | TCGA |
Note: Click image to view full size file.
Copy number change of PTPRU:
| Dataset | Gene | EntrezID | Gain | Loss | Normal | Detail |
|---|---|---|---|---|---|---|
| GSE15526 | PTPRU | 10076 | 0 | 6 | 24 | |
| GSE20123 | PTPRU | 10076 | 0 | 5 | 25 | |
| GSE43470 | PTPRU | 10076 | 3 | 6 | 34 | |
| GSE46452 | PTPRU | 10076 | 5 | 1 | 53 | |
| GSE47630 | PTPRU | 10076 | 8 | 3 | 29 | |
| GSE54993 | PTPRU | 10076 | 2 | 1 | 67 | |
| GSE54994 | PTPRU | 10076 | 10 | 4 | 39 | |
| GSE60625 | PTPRU | 10076 | 0 | 0 | 11 | |
| GSE74703 | PTPRU | 10076 | 2 | 4 | 30 | |
| GSE74704 | PTPRU | 10076 | 0 | 0 | 20 | |
| TCGA | PTPRU | 10076 | 11 | 21 | 64 |
Total number of gains: 41; Total number of losses: 51; Total Number of normals: 396.
Somatic mutations of PTPRU:
Generating mutation plots.
Highly correlated genes for PTPRU:
Showing top 20/500 corelated genes with mean PCC>0.5.
| Gene1 | Gene2 | Mean PCC | Num. Datasets | Num. PCC<0 | Num. PCC>0.5 |
|---|---|---|---|---|---|
| PTPRU | MAP2K5 | 0.795283 | 3 | 0 | 3 |
| PTPRU | GYG2 | 0.778676 | 3 | 0 | 3 |
| PTPRU | STUB1 | 0.7754 | 3 | 0 | 3 |
| PTPRU | LRTOMT | 0.770649 | 3 | 0 | 3 |
| PTPRU | ARHGAP42 | 0.760103 | 3 | 0 | 3 |
| PTPRU | CYHR1 | 0.75666 | 3 | 0 | 3 |
| PTPRU | LRRC41 | 0.754773 | 3 | 0 | 3 |
| PTPRU | RRNAD1 | 0.748767 | 3 | 0 | 3 |
| PTPRU | COPS7A | 0.74623 | 3 | 0 | 3 |
| PTPRU | C11orf68 | 0.745555 | 3 | 0 | 3 |
| PTPRU | POLA1 | 0.743812 | 3 | 0 | 3 |
| PTPRU | NR2C2AP | 0.738777 | 3 | 0 | 3 |
| PTPRU | ACAP1 | 0.731934 | 3 | 0 | 3 |
| PTPRU | POU2F2 | 0.7314 | 4 | 0 | 3 |
| PTPRU | CD22 | 0.72016 | 5 | 0 | 5 |
| PTPRU | NUMA1 | 0.716544 | 3 | 0 | 3 |
| PTPRU | AGBL5 | 0.716036 | 4 | 0 | 4 |
| PTPRU | KIAA0040 | 0.714788 | 3 | 0 | 3 |
| PTPRU | GCDH | 0.714327 | 3 | 0 | 3 |
| PTPRU | GEMIN7 | 0.71248 | 3 | 0 | 3 |
For details and further investigation, click here