| Full name: 6-pyruvoyltetrahydropterin synthase | Alias Symbol: PTPS | ||
| Type: protein-coding gene | Cytoband: 11q22.3 | ||
| Entrez ID: 5805 | HGNC ID: HGNC:9689 | Ensembl Gene: ENSG00000150787 | OMIM ID: 612719 |
Expression of PTS:
| Dataset | Gene | EntrezID | Probe | Log2FC | Adj.pValue | Expression |
|---|---|---|---|---|---|---|
| GSE17351 | PTS | 5805 | 209694_at | -0.0373 | 0.9297 | |
| GSE20347 | PTS | 5805 | 209694_at | -0.2912 | 0.0965 | |
| GSE23400 | PTS | 5805 | 209694_at | -0.0466 | 0.5805 | |
| GSE26886 | PTS | 5805 | 209694_at | -0.7697 | 0.0028 | |
| GSE29001 | PTS | 5805 | 209694_at | -0.3716 | 0.0934 | |
| GSE38129 | PTS | 5805 | 209694_at | -0.0758 | 0.6426 | |
| GSE45670 | PTS | 5805 | 209694_at | 0.1162 | 0.5158 | |
| GSE53622 | PTS | 5805 | 139121 | -0.2329 | 0.0058 | |
| GSE53624 | PTS | 5805 | 139121 | -0.1314 | 0.0513 | |
| GSE63941 | PTS | 5805 | 209694_at | -0.4841 | 0.3620 | |
| GSE77861 | PTS | 5805 | 209694_at | 0.1239 | 0.6925 | |
| GSE97050 | PTS | 5805 | A_23_P127579 | 0.0425 | 0.8415 | |
| SRP007169 | PTS | 5805 | RNAseq | -0.5169 | 0.2420 | |
| SRP008496 | PTS | 5805 | RNAseq | -0.4055 | 0.1369 | |
| SRP064894 | PTS | 5805 | RNAseq | -0.3527 | 0.0779 | |
| SRP133303 | PTS | 5805 | RNAseq | 0.0208 | 0.8980 | |
| SRP159526 | PTS | 5805 | RNAseq | -0.4022 | 0.2654 | |
| SRP193095 | PTS | 5805 | RNAseq | -0.8570 | 0.0000 | |
| SRP219564 | PTS | 5805 | RNAseq | -0.5948 | 0.0319 | |
| TCGA | PTS | 5805 | RNAseq | -0.0264 | 0.7524 |
Upregulated datasets: 0; Downregulated datasets: 0.
Survival by PTS expression:
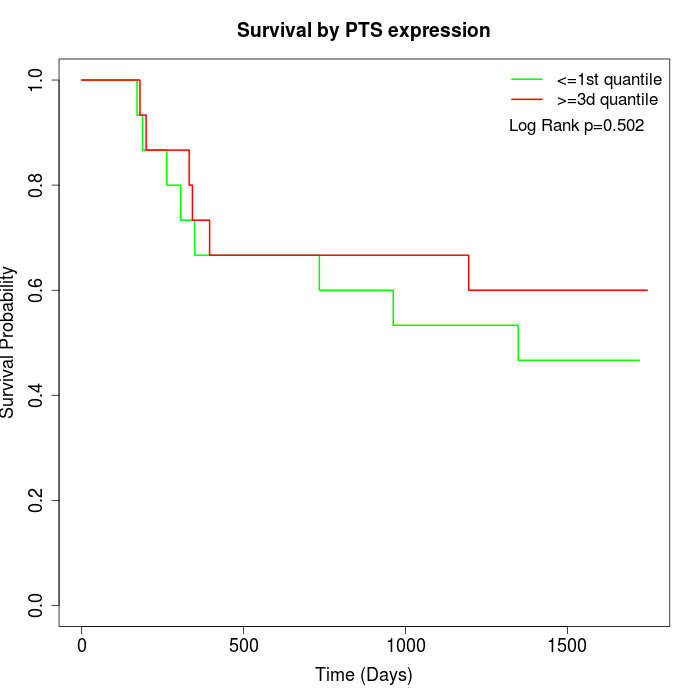 | 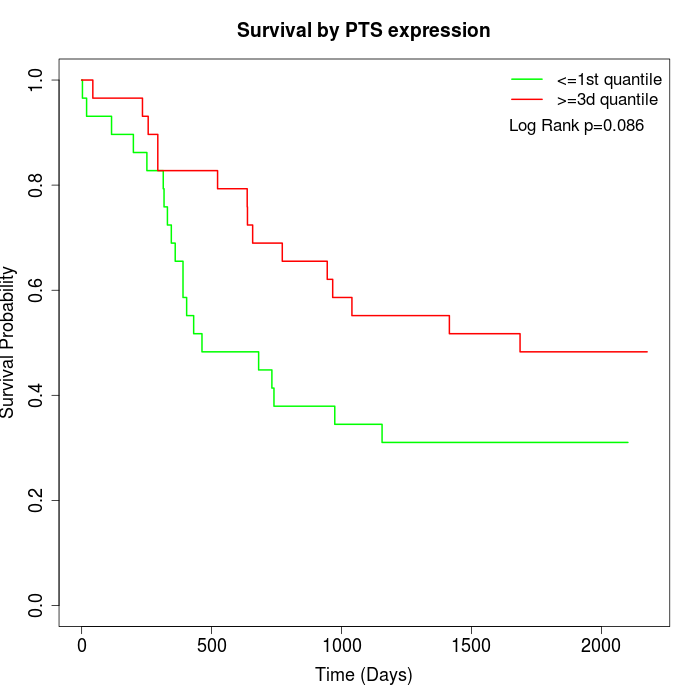 | 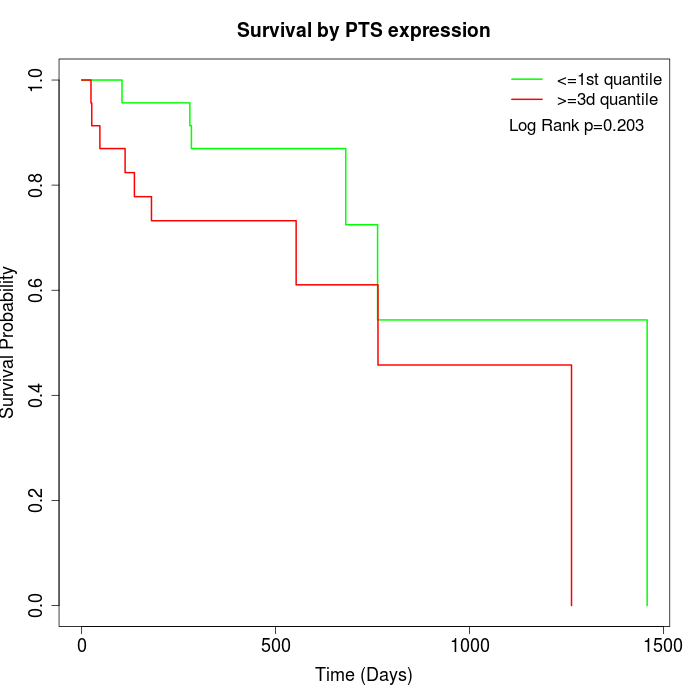 |
| GSE53622 | GSE53624 | TCGA |
Note: Click image to view full size file.
Copy number change of PTS:
| Dataset | Gene | EntrezID | Gain | Loss | Normal | Detail |
|---|---|---|---|---|---|---|
| GSE15526 | PTS | 5805 | 0 | 12 | 18 | |
| GSE20123 | PTS | 5805 | 0 | 12 | 18 | |
| GSE43470 | PTS | 5805 | 2 | 6 | 35 | |
| GSE46452 | PTS | 5805 | 3 | 26 | 30 | |
| GSE47630 | PTS | 5805 | 2 | 19 | 19 | |
| GSE54993 | PTS | 5805 | 10 | 0 | 60 | |
| GSE54994 | PTS | 5805 | 5 | 19 | 29 | |
| GSE60625 | PTS | 5805 | 0 | 3 | 8 | |
| GSE74703 | PTS | 5805 | 1 | 4 | 31 | |
| GSE74704 | PTS | 5805 | 0 | 8 | 12 | |
| TCGA | PTS | 5805 | 7 | 48 | 41 |
Total number of gains: 30; Total number of losses: 157; Total Number of normals: 301.
Somatic mutations of PTS:
Generating mutation plots.
Highly correlated genes for PTS:
Showing top 20/219 corelated genes with mean PCC>0.5.
| Gene1 | Gene2 | Mean PCC | Num. Datasets | Num. PCC<0 | Num. PCC>0.5 |
|---|---|---|---|---|---|
| PTS | SPCS2 | 0.774598 | 3 | 0 | 3 |
| PTS | NUFIP2 | 0.758711 | 3 | 0 | 3 |
| PTS | ZNF416 | 0.758017 | 3 | 0 | 3 |
| PTS | BTBD1 | 0.736632 | 3 | 0 | 3 |
| PTS | CCDC84 | 0.716828 | 4 | 0 | 3 |
| PTS | EMG1 | 0.71192 | 3 | 0 | 3 |
| PTS | IREB2 | 0.711369 | 4 | 0 | 4 |
| PTS | WDR12 | 0.701564 | 3 | 0 | 3 |
| PTS | CUL5 | 0.70113 | 7 | 0 | 7 |
| PTS | PHKA1 | 0.688654 | 3 | 0 | 3 |
| PTS | MTMR10 | 0.686883 | 4 | 0 | 4 |
| PTS | NEK7 | 0.686154 | 3 | 0 | 3 |
| PTS | CUL1 | 0.677811 | 3 | 0 | 3 |
| PTS | CSE1L | 0.672506 | 3 | 0 | 3 |
| PTS | SRXN1 | 0.669782 | 3 | 0 | 3 |
| PTS | SMO | 0.666027 | 3 | 0 | 3 |
| PTS | SLC12A6 | 0.663664 | 4 | 0 | 4 |
| PTS | CEPT1 | 0.663354 | 4 | 0 | 4 |
| PTS | EXOC5 | 0.659927 | 4 | 0 | 4 |
| PTS | TMEM181 | 0.659785 | 4 | 0 | 3 |
For details and further investigation, click here