| Full name: radial spoke head 9 homolog | Alias Symbol: FLJ30845|CILD12 | ||
| Type: protein-coding gene | Cytoband: 6p21.1 | ||
| Entrez ID: 221421 | HGNC ID: HGNC:21057 | Ensembl Gene: ENSG00000172426 | OMIM ID: 612648 |
Expression of RSPH9:
| Dataset | Gene | EntrezID | Probe | Log2FC | Adj.pValue | Expression |
|---|---|---|---|---|---|---|
| GSE17351 | RSPH9 | 221421 | 230695_s_at | -0.1907 | 0.5862 | |
| GSE26886 | RSPH9 | 221421 | 230695_s_at | 0.2445 | 0.0404 | |
| GSE45670 | RSPH9 | 221421 | 230695_s_at | -0.0178 | 0.8626 | |
| GSE53622 | RSPH9 | 221421 | 48252 | -0.0046 | 0.9464 | |
| GSE53624 | RSPH9 | 221421 | 48252 | -0.2617 | 0.0013 | |
| GSE63941 | RSPH9 | 221421 | 230695_s_at | -0.6582 | 0.0001 | |
| GSE77861 | RSPH9 | 221421 | 230695_s_at | -0.0712 | 0.6100 | |
| GSE97050 | RSPH9 | 221421 | A_33_P3248749 | 0.0376 | 0.8872 | |
| SRP133303 | RSPH9 | 221421 | RNAseq | -0.0736 | 0.7193 | |
| SRP159526 | RSPH9 | 221421 | RNAseq | -0.2905 | 0.5858 | |
| SRP193095 | RSPH9 | 221421 | RNAseq | -0.0425 | 0.7875 | |
| SRP219564 | RSPH9 | 221421 | RNAseq | -0.2893 | 0.5196 | |
| TCGA | RSPH9 | 221421 | RNAseq | -0.4247 | 0.3239 |
Upregulated datasets: 0; Downregulated datasets: 0.
Survival by RSPH9 expression:
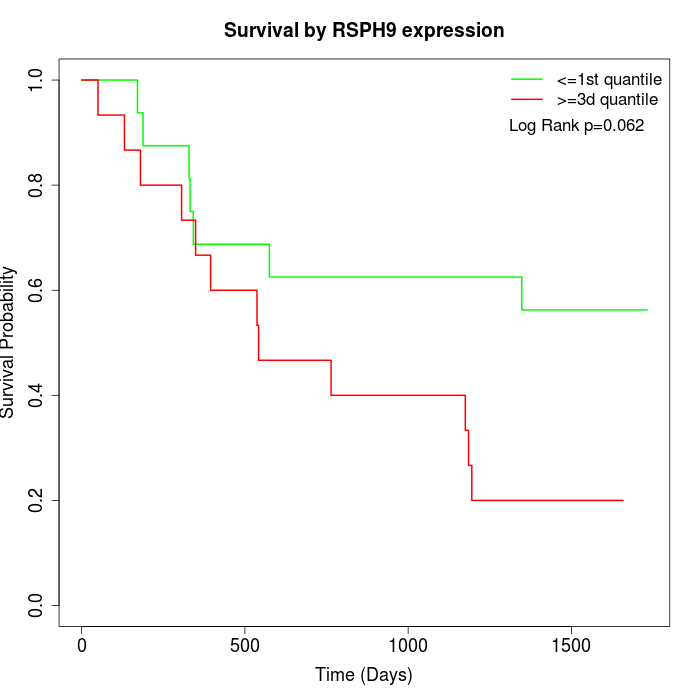 | 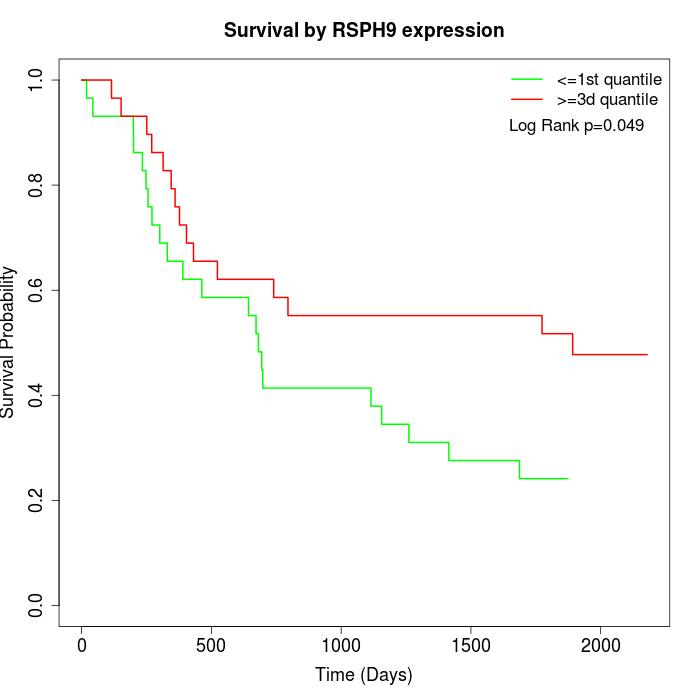 | 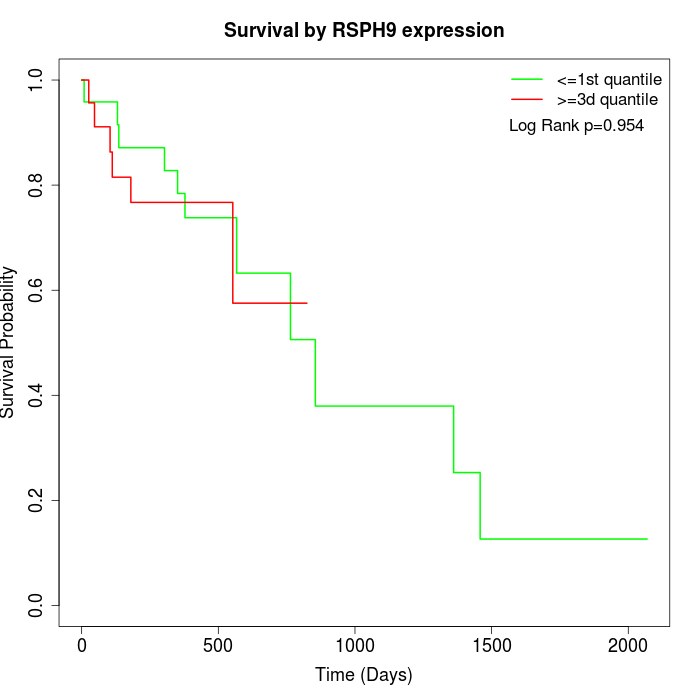 |
| GSE53622 | GSE53624 | TCGA |
Note: Click image to view full size file.
Copy number change of RSPH9:
| Dataset | Gene | EntrezID | Gain | Loss | Normal | Detail |
|---|---|---|---|---|---|---|
| GSE15526 | RSPH9 | 221421 | 7 | 0 | 23 | |
| GSE20123 | RSPH9 | 221421 | 7 | 0 | 23 | |
| GSE43470 | RSPH9 | 221421 | 6 | 0 | 37 | |
| GSE46452 | RSPH9 | 221421 | 2 | 9 | 48 | |
| GSE47630 | RSPH9 | 221421 | 8 | 4 | 28 | |
| GSE54993 | RSPH9 | 221421 | 3 | 2 | 65 | |
| GSE54994 | RSPH9 | 221421 | 10 | 4 | 39 | |
| GSE60625 | RSPH9 | 221421 | 0 | 1 | 10 | |
| GSE74703 | RSPH9 | 221421 | 6 | 0 | 30 | |
| GSE74704 | RSPH9 | 221421 | 3 | 0 | 17 | |
| TCGA | RSPH9 | 221421 | 22 | 11 | 63 |
Total number of gains: 74; Total number of losses: 31; Total Number of normals: 383.
Somatic mutations of RSPH9:
Generating mutation plots.
Highly correlated genes for RSPH9:
Showing top 20/261 corelated genes with mean PCC>0.5.
| Gene1 | Gene2 | Mean PCC | Num. Datasets | Num. PCC<0 | Num. PCC>0.5 |
|---|---|---|---|---|---|
| RSPH9 | FGFR1 | 0.766971 | 3 | 0 | 3 |
| RSPH9 | IFFO1 | 0.757491 | 4 | 0 | 4 |
| RSPH9 | FOXF1 | 0.748102 | 3 | 0 | 3 |
| RSPH9 | EDNRB | 0.744986 | 3 | 0 | 3 |
| RSPH9 | SPEG | 0.733205 | 3 | 0 | 3 |
| RSPH9 | NKAPL | 0.731942 | 4 | 0 | 4 |
| RSPH9 | KIR3DL2 | 0.723911 | 3 | 0 | 3 |
| RSPH9 | ACRBP | 0.722916 | 4 | 0 | 4 |
| RSPH9 | STX2 | 0.719773 | 4 | 0 | 4 |
| RSPH9 | OR1L6 | 0.719056 | 3 | 0 | 3 |
| RSPH9 | FNBP1 | 0.71808 | 3 | 0 | 3 |
| RSPH9 | GSG1 | 0.711506 | 4 | 0 | 4 |
| RSPH9 | CTPS2 | 0.70412 | 3 | 0 | 3 |
| RSPH9 | RAPGEF3 | 0.703977 | 3 | 0 | 3 |
| RSPH9 | TRPC6 | 0.702343 | 3 | 0 | 3 |
| RSPH9 | SAR1A | 0.700693 | 3 | 0 | 3 |
| RSPH9 | CISD3 | 0.700494 | 3 | 0 | 3 |
| RSPH9 | KRTAP9-6 | 0.699613 | 3 | 0 | 3 |
| RSPH9 | FENDRR | 0.695712 | 3 | 0 | 3 |
| RSPH9 | KRTAP10-9 | 0.695386 | 3 | 0 | 3 |
For details and further investigation, click here