| Full name: S100 calcium binding protein A14 | Alias Symbol: S100A15|BCMP84 | ||
| Type: protein-coding gene | Cytoband: 1q21.3 | ||
| Entrez ID: 57402 | HGNC ID: HGNC:18901 | Ensembl Gene: ENSG00000189334 | OMIM ID: 607986 |
Expression of S100A14:
| Dataset | Gene | EntrezID | Probe | Log2FC | Adj.pValue | Expression |
|---|---|---|---|---|---|---|
| GSE17351 | S100A14 | 57402 | 218677_at | -0.9231 | 0.1205 | |
| GSE20347 | S100A14 | 57402 | 218677_at | -2.1433 | 0.0000 | |
| GSE23400 | S100A14 | 57402 | 218677_at | -1.7225 | 0.0000 | |
| GSE26886 | S100A14 | 57402 | 218677_at | -2.6262 | 0.0000 | |
| GSE29001 | S100A14 | 57402 | 218677_at | -1.9143 | 0.0000 | |
| GSE38129 | S100A14 | 57402 | 218677_at | -1.0408 | 0.0832 | |
| GSE45670 | S100A14 | 57402 | 218677_at | -0.7340 | 0.0164 | |
| GSE53622 | S100A14 | 57402 | 24715 | -2.2296 | 0.0000 | |
| GSE53624 | S100A14 | 57402 | 24715 | -2.7346 | 0.0000 | |
| GSE63941 | S100A14 | 57402 | 218677_at | 4.0861 | 0.0150 | |
| GSE77861 | S100A14 | 57402 | 218677_at | -0.9483 | 0.0033 | |
| GSE97050 | S100A14 | 57402 | A_23_P124619 | -0.4747 | 0.7921 | |
| SRP007169 | S100A14 | 57402 | RNAseq | -5.0101 | 0.0000 | |
| SRP008496 | S100A14 | 57402 | RNAseq | -5.0955 | 0.0000 | |
| SRP064894 | S100A14 | 57402 | RNAseq | -3.4847 | 0.0000 | |
| SRP133303 | S100A14 | 57402 | RNAseq | -3.0096 | 0.0000 | |
| SRP159526 | S100A14 | 57402 | RNAseq | -4.2495 | 0.0000 | |
| SRP193095 | S100A14 | 57402 | RNAseq | -3.2877 | 0.0000 | |
| SRP219564 | S100A14 | 57402 | RNAseq | -3.1895 | 0.0152 | |
| TCGA | S100A14 | 57402 | RNAseq | 0.4677 | 0.0158 |
Upregulated datasets: 1; Downregulated datasets: 13.
Survival by S100A14 expression:
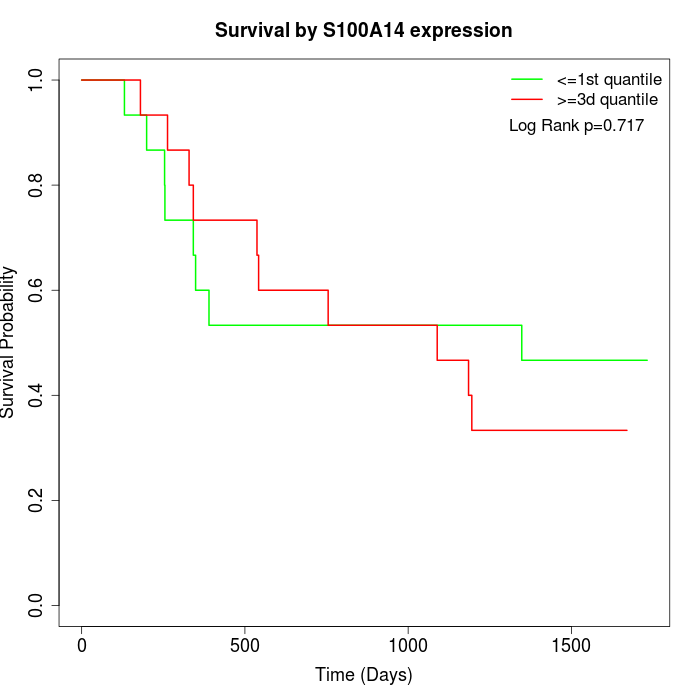 | 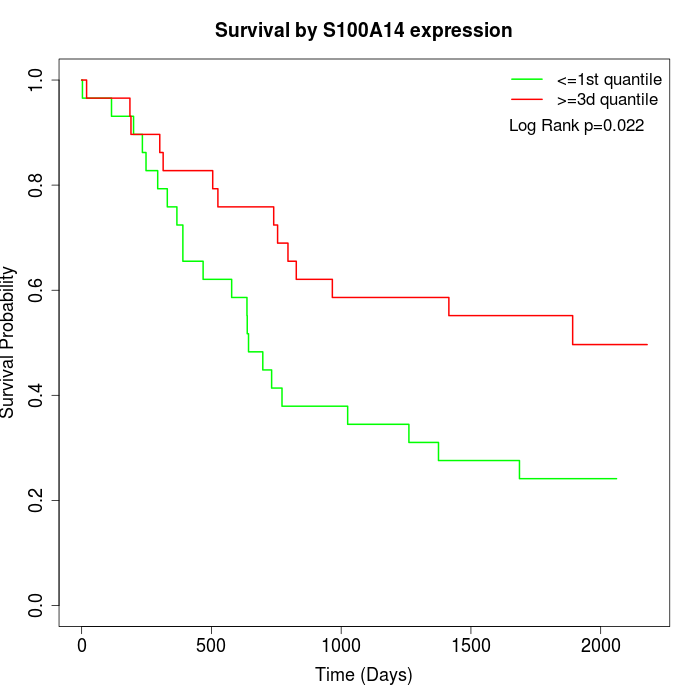 | 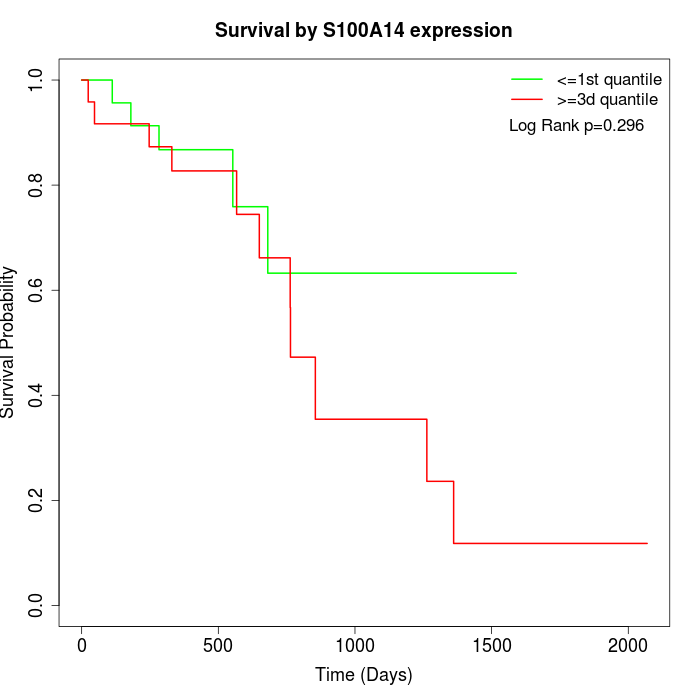 |
| GSE53622 | GSE53624 | TCGA |
Note: Click image to view full size file.
Copy number change of S100A14:
| Dataset | Gene | EntrezID | Gain | Loss | Normal | Detail |
|---|---|---|---|---|---|---|
| GSE15526 | S100A14 | 57402 | 14 | 0 | 16 | |
| GSE20123 | S100A14 | 57402 | 14 | 0 | 16 | |
| GSE43470 | S100A14 | 57402 | 7 | 2 | 34 | |
| GSE46452 | S100A14 | 57402 | 2 | 1 | 56 | |
| GSE47630 | S100A14 | 57402 | 14 | 0 | 26 | |
| GSE54993 | S100A14 | 57402 | 0 | 4 | 66 | |
| GSE54994 | S100A14 | 57402 | 16 | 0 | 37 | |
| GSE60625 | S100A14 | 57402 | 0 | 0 | 11 | |
| GSE74703 | S100A14 | 57402 | 6 | 1 | 29 | |
| GSE74704 | S100A14 | 57402 | 7 | 0 | 13 | |
| TCGA | S100A14 | 57402 | 38 | 2 | 56 |
Total number of gains: 118; Total number of losses: 10; Total Number of normals: 360.
Somatic mutations of S100A14:
Generating mutation plots.
Highly correlated genes for S100A14:
Showing top 20/1374 corelated genes with mean PCC>0.5.
| Gene1 | Gene2 | Mean PCC | Num. Datasets | Num. PCC<0 | Num. PCC>0.5 |
|---|---|---|---|---|---|
| S100A14 | CYSRT1 | 0.894805 | 6 | 0 | 6 |
| S100A14 | IL18 | 0.863367 | 11 | 0 | 11 |
| S100A14 | EPS8L2 | 0.860565 | 11 | 0 | 11 |
| S100A14 | CSTB | 0.859596 | 12 | 0 | 12 |
| S100A14 | KRT78 | 0.855818 | 7 | 0 | 7 |
| S100A14 | S100A16 | 0.848307 | 9 | 0 | 9 |
| S100A14 | SERPINB1 | 0.846007 | 12 | 0 | 12 |
| S100A14 | FCHO2 | 0.843851 | 6 | 0 | 6 |
| S100A14 | CLIC3 | 0.842703 | 10 | 0 | 10 |
| S100A14 | IL1RN | 0.840534 | 13 | 0 | 12 |
| S100A14 | CRCT1 | 0.839901 | 12 | 0 | 11 |
| S100A14 | RHCG | 0.837053 | 12 | 0 | 12 |
| S100A14 | PDCD6IP | 0.836303 | 10 | 0 | 10 |
| S100A14 | ACPP | 0.835226 | 11 | 0 | 11 |
| S100A14 | SPINK5 | 0.834816 | 12 | 0 | 12 |
| S100A14 | VSIG10L | 0.833608 | 7 | 0 | 7 |
| S100A14 | PKP3 | 0.832664 | 12 | 0 | 12 |
| S100A14 | C6orf132 | 0.831944 | 8 | 0 | 7 |
| S100A14 | CWH43 | 0.830819 | 10 | 0 | 10 |
| S100A14 | MALL | 0.829294 | 12 | 0 | 12 |
For details and further investigation, click here