| Full name: S100 calcium binding protein A9 | Alias Symbol: P14|MIF|NIF|LIAG|MRP14|MAC387|60B8AG|CGLB | ||
| Type: protein-coding gene | Cytoband: 1q21.3 | ||
| Entrez ID: 6280 | HGNC ID: HGNC:10499 | Ensembl Gene: ENSG00000163220 | OMIM ID: 123886 |
Expression of S100A9:
| Dataset | Gene | EntrezID | Probe | Log2FC | Adj.pValue | Expression |
|---|---|---|---|---|---|---|
| GSE17351 | S100A9 | 6280 | 203535_at | -0.5507 | 0.6041 | |
| GSE20347 | S100A9 | 6280 | 203535_at | -2.1965 | 0.0004 | |
| GSE23400 | S100A9 | 6280 | 203535_at | -1.6476 | 0.0000 | |
| GSE26886 | S100A9 | 6280 | 203535_at | -4.5998 | 0.0000 | |
| GSE29001 | S100A9 | 6280 | 203535_at | -2.6041 | 0.0033 | |
| GSE38129 | S100A9 | 6280 | 203535_at | -1.1892 | 0.1167 | |
| GSE45670 | S100A9 | 6280 | 203535_at | -0.0913 | 0.5195 | |
| GSE53622 | S100A9 | 6280 | 91637 | -2.0339 | 0.0000 | |
| GSE53624 | S100A9 | 6280 | 91637 | -2.5570 | 0.0000 | |
| GSE63941 | S100A9 | 6280 | 203535_at | 2.7831 | 0.1059 | |
| GSE77861 | S100A9 | 6280 | 203535_at | -0.6663 | 0.0782 | |
| GSE97050 | S100A9 | 6280 | A_23_P23048 | -0.2390 | 0.7897 | |
| SRP007169 | S100A9 | 6280 | RNAseq | -7.7757 | 0.0000 | |
| SRP008496 | S100A9 | 6280 | RNAseq | -4.9967 | 0.0000 | |
| SRP064894 | S100A9 | 6280 | RNAseq | -3.2988 | 0.0000 | |
| SRP133303 | S100A9 | 6280 | RNAseq | -3.0561 | 0.0000 | |
| SRP159526 | S100A9 | 6280 | RNAseq | -3.5871 | 0.0001 | |
| SRP193095 | S100A9 | 6280 | RNAseq | -2.4531 | 0.0000 | |
| SRP219564 | S100A9 | 6280 | RNAseq | -3.5871 | 0.0042 | |
| TCGA | S100A9 | 6280 | RNAseq | 0.7630 | 0.0001 |
Upregulated datasets: 0; Downregulated datasets: 13.
Survival by S100A9 expression:
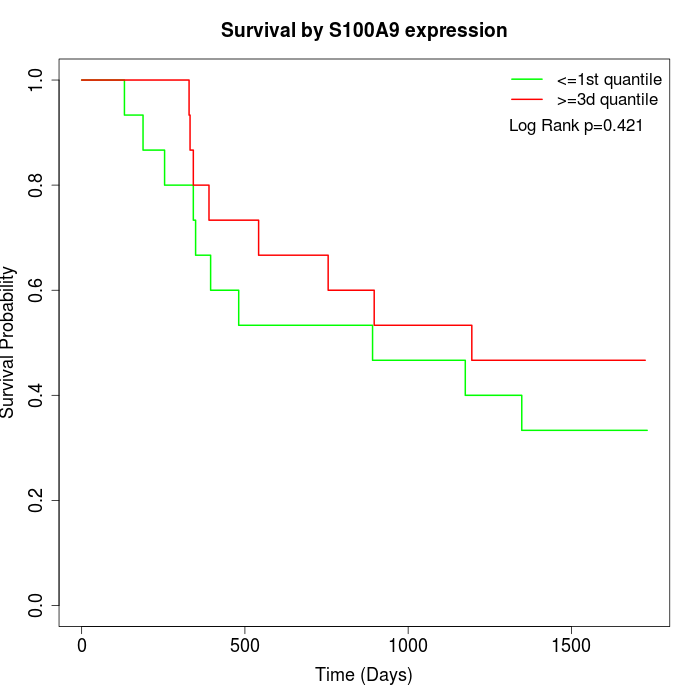 | 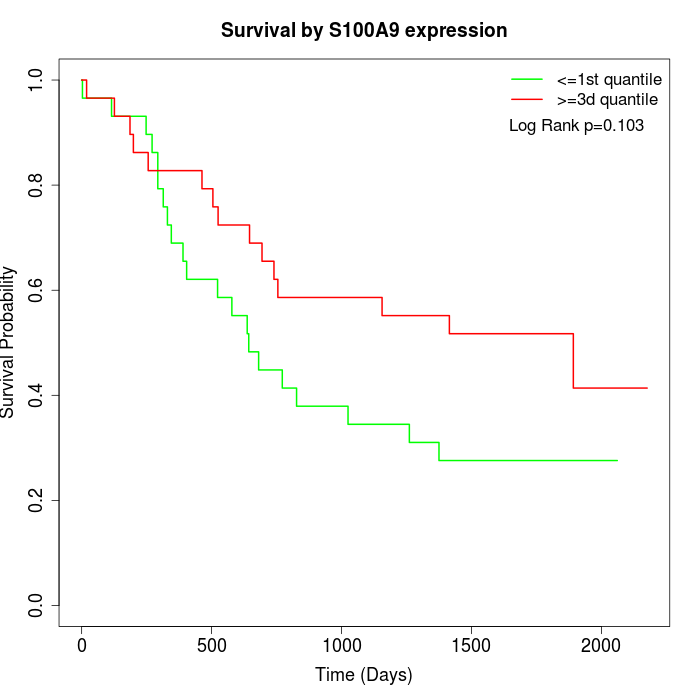 | 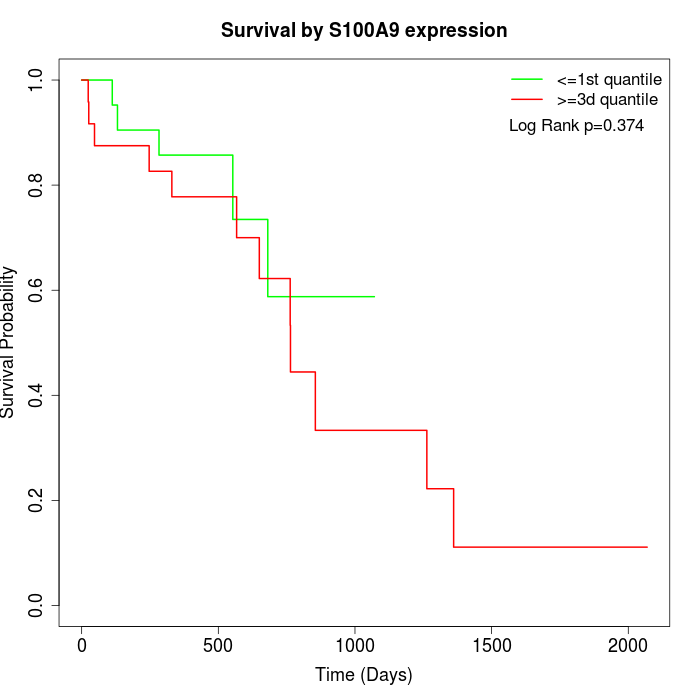 |
| GSE53622 | GSE53624 | TCGA |
Note: Click image to view full size file.
Copy number change of S100A9:
| Dataset | Gene | EntrezID | Gain | Loss | Normal | Detail |
|---|---|---|---|---|---|---|
| GSE15526 | S100A9 | 6280 | 14 | 0 | 16 | |
| GSE20123 | S100A9 | 6280 | 14 | 0 | 16 | |
| GSE43470 | S100A9 | 6280 | 6 | 2 | 35 | |
| GSE46452 | S100A9 | 6280 | 2 | 1 | 56 | |
| GSE47630 | S100A9 | 6280 | 15 | 0 | 25 | |
| GSE54993 | S100A9 | 6280 | 0 | 4 | 66 | |
| GSE54994 | S100A9 | 6280 | 16 | 0 | 37 | |
| GSE60625 | S100A9 | 6280 | 0 | 0 | 11 | |
| GSE74703 | S100A9 | 6280 | 6 | 1 | 29 | |
| GSE74704 | S100A9 | 6280 | 7 | 0 | 13 | |
| TCGA | S100A9 | 6280 | 40 | 2 | 54 |
Total number of gains: 120; Total number of losses: 10; Total Number of normals: 358.
Somatic mutations of S100A9:
Generating mutation plots.
Highly correlated genes for S100A9:
Showing top 20/967 corelated genes with mean PCC>0.5.
| Gene1 | Gene2 | Mean PCC | Num. Datasets | Num. PCC<0 | Num. PCC>0.5 |
|---|---|---|---|---|---|
| S100A9 | S100A8 | 0.931334 | 13 | 0 | 13 |
| S100A9 | SPRR2A | 0.829387 | 4 | 0 | 4 |
| S100A9 | SPRR2F | 0.828259 | 4 | 0 | 4 |
| S100A9 | CNFN | 0.827231 | 8 | 0 | 8 |
| S100A9 | SPRR2E | 0.818583 | 4 | 0 | 4 |
| S100A9 | SBSN | 0.813865 | 8 | 0 | 8 |
| S100A9 | SPRR2D | 0.804547 | 4 | 0 | 4 |
| S100A9 | RHCG | 0.799209 | 12 | 0 | 12 |
| S100A9 | VSIG10L | 0.792268 | 7 | 0 | 7 |
| S100A9 | TGM1 | 0.790909 | 12 | 0 | 12 |
| S100A9 | SERPINB13 | 0.78535 | 10 | 0 | 10 |
| S100A9 | KCNA7 | 0.785167 | 3 | 0 | 3 |
| S100A9 | NCCRP1 | 0.783099 | 4 | 0 | 4 |
| S100A9 | CYSRT1 | 0.780024 | 7 | 0 | 7 |
| S100A9 | KRT13 | 0.778011 | 10 | 0 | 10 |
| S100A9 | OTOP3 | 0.777774 | 3 | 0 | 3 |
| S100A9 | LYPD3 | 0.774921 | 13 | 0 | 12 |
| S100A9 | CRCT1 | 0.770576 | 12 | 0 | 12 |
| S100A9 | S100A12 | 0.768856 | 11 | 0 | 11 |
| S100A9 | SPRR1B | 0.76885 | 11 | 0 | 11 |
For details and further investigation, click here