| Full name: serpin family B member 13 | Alias Symbol: HUR7|hurpin|headpin | ||
| Type: protein-coding gene | Cytoband: 18q21.33 | ||
| Entrez ID: 5275 | HGNC ID: HGNC:8944 | Ensembl Gene: ENSG00000197641 | OMIM ID: 604445 |
Expression of SERPINB13:
| Dataset | Gene | EntrezID | Probe | Log2FC | Adj.pValue | Expression |
|---|---|---|---|---|---|---|
| GSE17351 | SERPINB13 | 5275 | 217272_s_at | -1.9528 | 0.3903 | |
| GSE20347 | SERPINB13 | 5275 | 217272_s_at | -3.3024 | 0.0000 | |
| GSE23400 | SERPINB13 | 5275 | 217272_s_at | -2.5671 | 0.0000 | |
| GSE26886 | SERPINB13 | 5275 | 217272_s_at | -5.0229 | 0.0000 | |
| GSE29001 | SERPINB13 | 5275 | 211361_s_at | -2.3974 | 0.0203 | |
| GSE38129 | SERPINB13 | 5275 | 217272_s_at | -1.7957 | 0.0424 | |
| GSE45670 | SERPINB13 | 5275 | 217272_s_at | -0.5989 | 0.0767 | |
| GSE53622 | SERPINB13 | 5275 | 84883 | -2.2956 | 0.0000 | |
| GSE53624 | SERPINB13 | 5275 | 84883 | -2.6526 | 0.0000 | |
| GSE63941 | SERPINB13 | 5275 | 217272_s_at | 3.7706 | 0.0576 | |
| GSE77861 | SERPINB13 | 5275 | 217272_s_at | -1.5637 | 0.1447 | |
| GSE97050 | SERPINB13 | 5275 | A_33_P3279019 | -0.9153 | 0.2868 | |
| SRP007169 | SERPINB13 | 5275 | RNAseq | -4.1376 | 0.0000 | |
| SRP008496 | SERPINB13 | 5275 | RNAseq | -3.5846 | 0.0000 | |
| SRP064894 | SERPINB13 | 5275 | RNAseq | -3.2384 | 0.0000 | |
| SRP133303 | SERPINB13 | 5275 | RNAseq | -2.0562 | 0.0001 | |
| SRP159526 | SERPINB13 | 5275 | RNAseq | -2.1852 | 0.0219 | |
| SRP219564 | SERPINB13 | 5275 | RNAseq | -2.7046 | 0.0258 | |
| TCGA | SERPINB13 | 5275 | RNAseq | 1.1015 | 0.0048 |
Upregulated datasets: 1; Downregulated datasets: 13.
Survival by SERPINB13 expression:
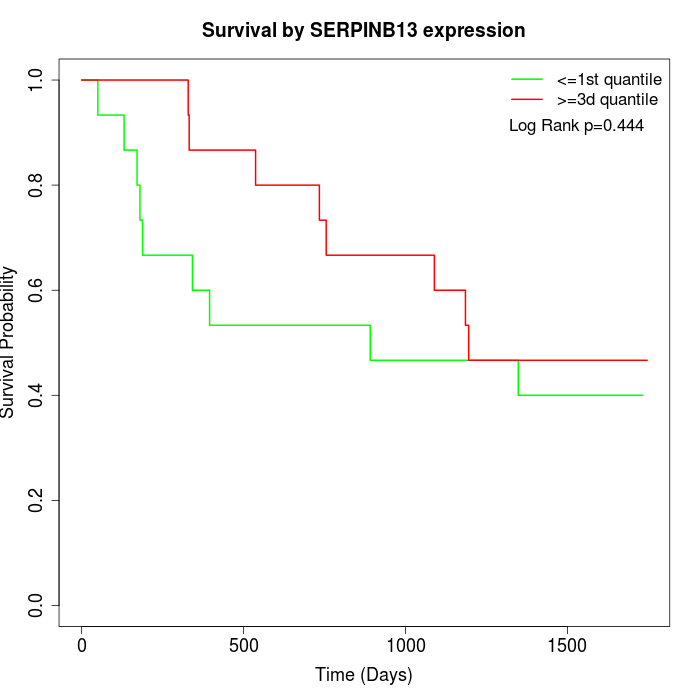 | 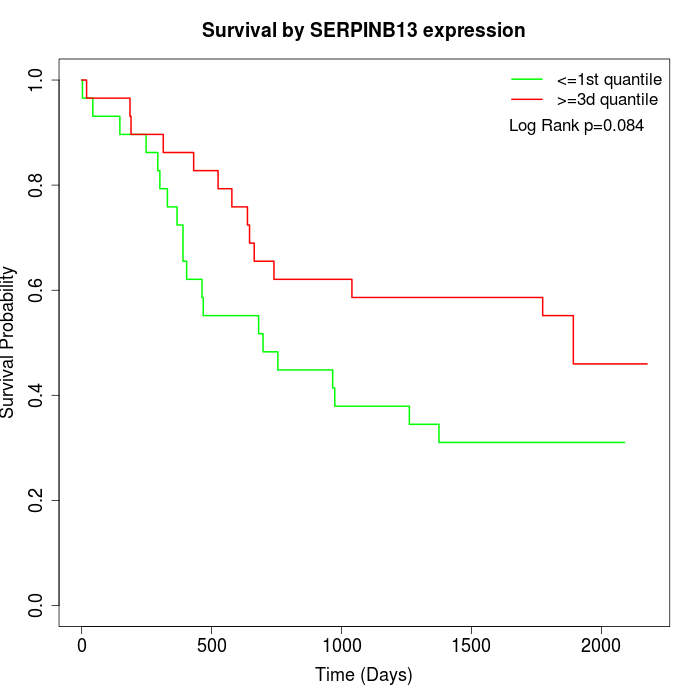 | 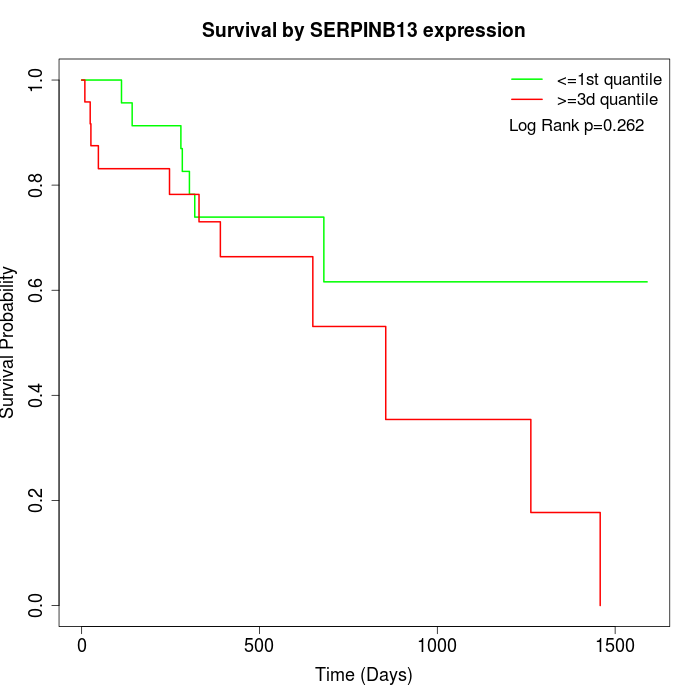 |
| GSE53622 | GSE53624 | TCGA |
Note: Click image to view full size file.
Copy number change of SERPINB13:
| Dataset | Gene | EntrezID | Gain | Loss | Normal | Detail |
|---|---|---|---|---|---|---|
| GSE15526 | SERPINB13 | 5275 | 1 | 9 | 20 | |
| GSE20123 | SERPINB13 | 5275 | 1 | 9 | 20 | |
| GSE43470 | SERPINB13 | 5275 | 0 | 7 | 36 | |
| GSE46452 | SERPINB13 | 5275 | 1 | 26 | 32 | |
| GSE47630 | SERPINB13 | 5275 | 5 | 21 | 14 | |
| GSE54993 | SERPINB13 | 5275 | 9 | 0 | 61 | |
| GSE54994 | SERPINB13 | 5275 | 1 | 18 | 34 | |
| GSE60625 | SERPINB13 | 5275 | 0 | 4 | 7 | |
| GSE74703 | SERPINB13 | 5275 | 0 | 7 | 29 | |
| GSE74704 | SERPINB13 | 5275 | 1 | 6 | 13 | |
| TCGA | SERPINB13 | 5275 | 10 | 45 | 41 |
Total number of gains: 29; Total number of losses: 152; Total Number of normals: 307.
Somatic mutations of SERPINB13:
Generating mutation plots.
Highly correlated genes for SERPINB13:
Showing top 20/1259 corelated genes with mean PCC>0.5.
| Gene1 | Gene2 | Mean PCC | Num. Datasets | Num. PCC<0 | Num. PCC>0.5 |
|---|---|---|---|---|---|
| SERPINB13 | TMPRSS11E | 0.842369 | 11 | 0 | 11 |
| SERPINB13 | SCEL | 0.830983 | 12 | 0 | 12 |
| SERPINB13 | SERPINB2 | 0.829901 | 12 | 0 | 11 |
| SERPINB13 | UPK3B | 0.826879 | 3 | 0 | 3 |
| SERPINB13 | CYSRT1 | 0.815912 | 6 | 0 | 6 |
| SERPINB13 | CSTB | 0.814166 | 12 | 0 | 11 |
| SERPINB13 | SPRR3 | 0.81054 | 12 | 0 | 12 |
| SERPINB13 | S100A16 | 0.807619 | 7 | 0 | 7 |
| SERPINB13 | MALL | 0.806252 | 12 | 0 | 12 |
| SERPINB13 | PPL | 0.802239 | 13 | 0 | 12 |
| SERPINB13 | SPRR1A | 0.802011 | 12 | 0 | 12 |
| SERPINB13 | EPGN | 0.801102 | 3 | 0 | 3 |
| SERPINB13 | TGM3 | 0.790411 | 12 | 0 | 12 |
| SERPINB13 | IL1RN | 0.786415 | 13 | 0 | 12 |
| SERPINB13 | CSTA | 0.78588 | 11 | 0 | 10 |
| SERPINB13 | S100A9 | 0.78535 | 10 | 0 | 10 |
| SERPINB13 | TMEM154 | 0.782442 | 7 | 0 | 7 |
| SERPINB13 | CNFN | 0.782059 | 8 | 0 | 7 |
| SERPINB13 | SERPINB3 | 0.780458 | 11 | 0 | 11 |
| SERPINB13 | EMP1 | 0.777344 | 12 | 0 | 11 |
For details and further investigation, click here