| Full name: sodium voltage-gated channel alpha subunit 4 | Alias Symbol: Nav1.4|HYPP|SkM1 | ||
| Type: protein-coding gene | Cytoband: 17q23.3 | ||
| Entrez ID: 6329 | HGNC ID: HGNC:10591 | Ensembl Gene: ENSG00000007314 | OMIM ID: 603967 |
| Related drugs: ARTICAINE HYDROCHLORIDE, BENOXINATE HYDROCHLORIDE, BUPIVACAINE, BUPIVACAINE HYDROCHLORIDE, CARBAMAZEPINE, CHEMBL1331919, CHEMBL270497, CHLOROPROCAINE HYDROCHLORIDE, DISOPYRAMIDE PHOSPHATE, DRONEDARONE HYDROCHLORIDE... [more] | |||
Expression of SCN4A:
| Dataset | Gene | EntrezID | Probe | Log2FC | Adj.pValue | Expression |
|---|---|---|---|---|---|---|
| GSE17351 | SCN4A | 6329 | 206981_at | 0.1122 | 0.6993 | |
| GSE20347 | SCN4A | 6329 | 206981_at | 0.1256 | 0.1317 | |
| GSE23400 | SCN4A | 6329 | 206981_at | -0.0906 | 0.0086 | |
| GSE26886 | SCN4A | 6329 | 206981_at | 0.0749 | 0.5854 | |
| GSE29001 | SCN4A | 6329 | 206981_at | -0.1804 | 0.2095 | |
| GSE38129 | SCN4A | 6329 | 206981_at | -0.1190 | 0.2019 | |
| GSE45670 | SCN4A | 6329 | 206981_at | 0.0132 | 0.9073 | |
| GSE53622 | SCN4A | 6329 | 32264 | 0.2620 | 0.0399 | |
| GSE53624 | SCN4A | 6329 | 32264 | 0.1931 | 0.0615 | |
| GSE63941 | SCN4A | 6329 | 206981_at | 0.2784 | 0.0677 | |
| GSE77861 | SCN4A | 6329 | 206981_at | -0.1326 | 0.1228 | |
| GSE97050 | SCN4A | 6329 | A_24_P270999 | -0.1148 | 0.8223 | |
| TCGA | SCN4A | 6329 | RNAseq | -1.8818 | 0.0021 |
Upregulated datasets: 0; Downregulated datasets: 1.
Survival by SCN4A expression:
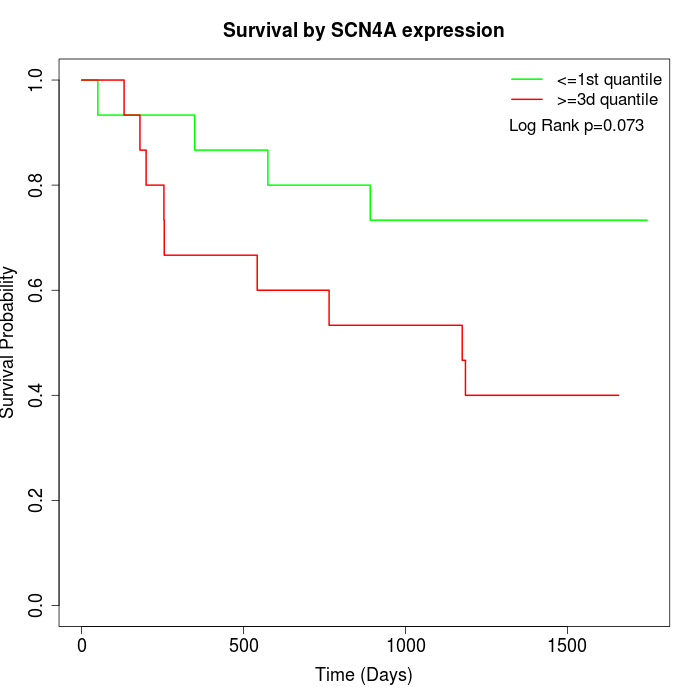 | 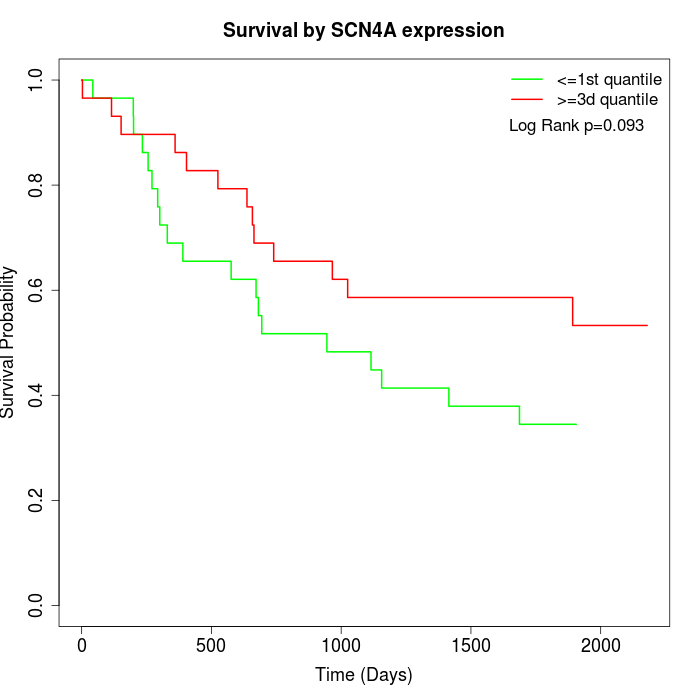 | 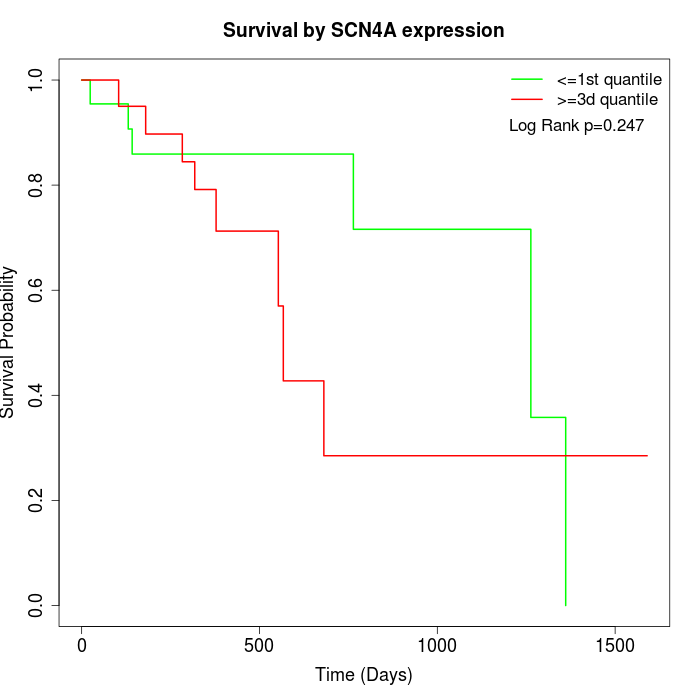 |
| GSE53622 | GSE53624 | TCGA |
Note: Click image to view full size file.
Copy number change of SCN4A:
| Dataset | Gene | EntrezID | Gain | Loss | Normal | Detail |
|---|---|---|---|---|---|---|
| GSE15526 | SCN4A | 6329 | 3 | 1 | 26 | |
| GSE20123 | SCN4A | 6329 | 3 | 1 | 26 | |
| GSE43470 | SCN4A | 6329 | 4 | 0 | 39 | |
| GSE46452 | SCN4A | 6329 | 31 | 0 | 28 | |
| GSE47630 | SCN4A | 6329 | 7 | 1 | 32 | |
| GSE54993 | SCN4A | 6329 | 2 | 5 | 63 | |
| GSE54994 | SCN4A | 6329 | 9 | 4 | 40 | |
| GSE60625 | SCN4A | 6329 | 4 | 0 | 7 | |
| GSE74703 | SCN4A | 6329 | 4 | 0 | 32 | |
| GSE74704 | SCN4A | 6329 | 3 | 1 | 16 | |
| TCGA | SCN4A | 6329 | 30 | 8 | 58 |
Total number of gains: 100; Total number of losses: 21; Total Number of normals: 367.
Somatic mutations of SCN4A:
Generating mutation plots.
Highly correlated genes for SCN4A:
Showing top 20/611 corelated genes with mean PCC>0.5.
| Gene1 | Gene2 | Mean PCC | Num. Datasets | Num. PCC<0 | Num. PCC>0.5 |
|---|---|---|---|---|---|
| SCN4A | SMIM6 | 0.687963 | 3 | 0 | 3 |
| SCN4A | SCGB1D1 | 0.679124 | 3 | 0 | 3 |
| SCN4A | UBE2D4 | 0.67307 | 4 | 0 | 4 |
| SCN4A | TRPC5 | 0.664285 | 3 | 0 | 3 |
| SCN4A | GYG2 | 0.660815 | 4 | 0 | 4 |
| SCN4A | EPHA5 | 0.645018 | 4 | 0 | 4 |
| SCN4A | GALNT8 | 0.64267 | 4 | 0 | 4 |
| SCN4A | AQP2 | 0.637379 | 5 | 0 | 4 |
| SCN4A | ULBP1 | 0.636993 | 3 | 0 | 3 |
| SCN4A | AKAP6 | 0.635351 | 5 | 0 | 5 |
| SCN4A | OR12D2 | 0.631377 | 5 | 0 | 5 |
| SCN4A | CHAT | 0.628166 | 4 | 0 | 4 |
| SCN4A | TAF6L | 0.62726 | 4 | 0 | 3 |
| SCN4A | NXPE4 | 0.627236 | 5 | 0 | 5 |
| SCN4A | HBD | 0.626569 | 4 | 0 | 4 |
| SCN4A | TMPRSS5 | 0.621652 | 7 | 0 | 5 |
| SCN4A | IRS4 | 0.620818 | 4 | 0 | 4 |
| SCN4A | GSN-AS1 | 0.620193 | 4 | 0 | 3 |
| SCN4A | NTRK3 | 0.619726 | 7 | 0 | 6 |
| SCN4A | SNAI1 | 0.618726 | 6 | 0 | 5 |
For details and further investigation, click here