| Full name: selenium binding protein 1 | Alias Symbol: hSP56|hSBP|LPSB | ||
| Type: protein-coding gene | Cytoband: 1q21.3 | ||
| Entrez ID: 8991 | HGNC ID: HGNC:10719 | Ensembl Gene: ENSG00000143416 | OMIM ID: 604188 |
Expression of SELENBP1:
| Dataset | Gene | EntrezID | Probe | Log2FC | Adj.pValue | Expression |
|---|---|---|---|---|---|---|
| GSE17351 | SELENBP1 | 8991 | 214433_s_at | -0.9794 | 0.2916 | |
| GSE20347 | SELENBP1 | 8991 | 214433_s_at | -0.6936 | 0.0083 | |
| GSE23400 | SELENBP1 | 8991 | 214433_s_at | -1.1591 | 0.0000 | |
| GSE26886 | SELENBP1 | 8991 | 214433_s_at | -1.4610 | 0.0003 | |
| GSE29001 | SELENBP1 | 8991 | 214433_s_at | -1.2819 | 0.0002 | |
| GSE38129 | SELENBP1 | 8991 | 214433_s_at | -1.3637 | 0.0000 | |
| GSE45670 | SELENBP1 | 8991 | 214433_s_at | -1.7236 | 0.0000 | |
| GSE53622 | SELENBP1 | 8991 | 46345 | -2.0685 | 0.0000 | |
| GSE53624 | SELENBP1 | 8991 | 46345 | -1.9742 | 0.0000 | |
| GSE63941 | SELENBP1 | 8991 | 214433_s_at | -2.8624 | 0.0768 | |
| GSE77861 | SELENBP1 | 8991 | 214433_s_at | -0.5704 | 0.0117 | |
| GSE97050 | SELENBP1 | 8991 | A_23_P86021 | -0.6915 | 0.2569 | |
| SRP007169 | SELENBP1 | 8991 | RNAseq | -2.1659 | 0.0000 | |
| SRP064894 | SELENBP1 | 8991 | RNAseq | -0.9406 | 0.0317 | |
| SRP133303 | SELENBP1 | 8991 | RNAseq | -1.3415 | 0.0005 | |
| SRP159526 | SELENBP1 | 8991 | RNAseq | -1.8157 | 0.0000 | |
| SRP193095 | SELENBP1 | 8991 | RNAseq | -1.4208 | 0.0029 | |
| SRP219564 | SELENBP1 | 8991 | RNAseq | -0.6006 | 0.4943 | |
| TCGA | SELENBP1 | 8991 | RNAseq | -1.3050 | 0.0000 |
Upregulated datasets: 0; Downregulated datasets: 12.
Survival by SELENBP1 expression:
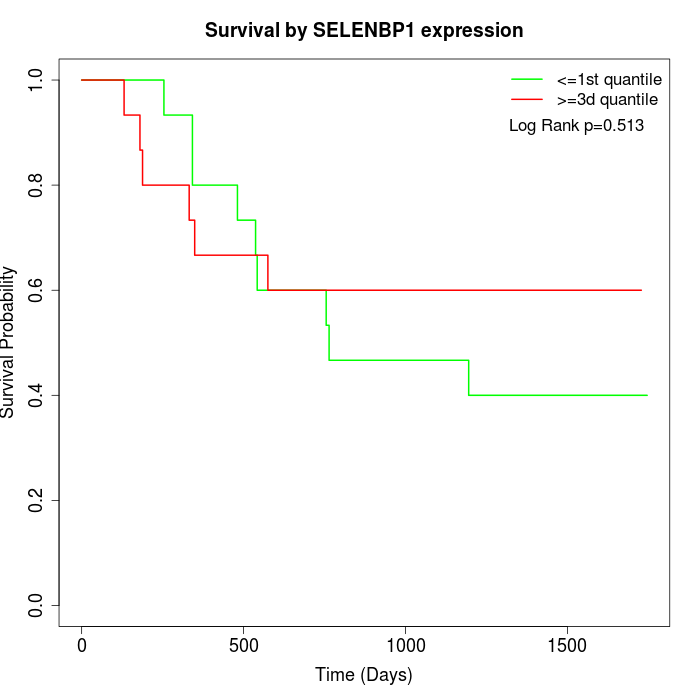 | 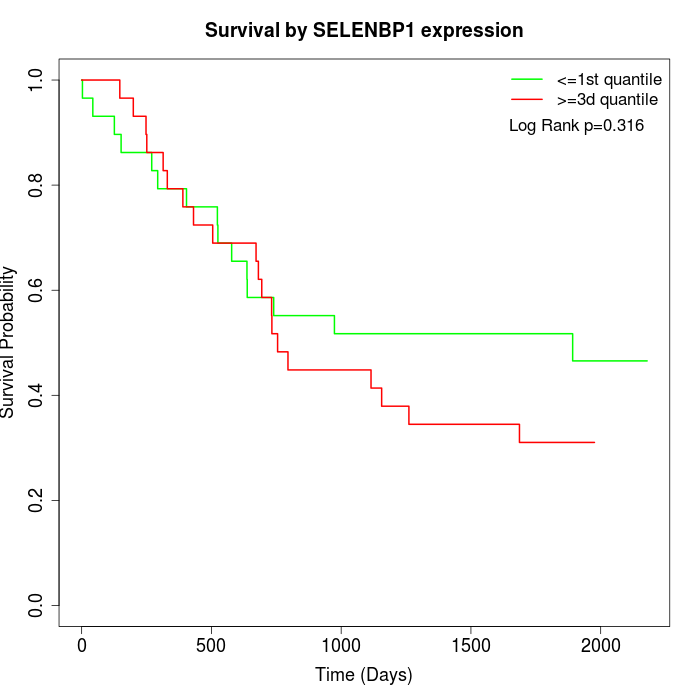 | 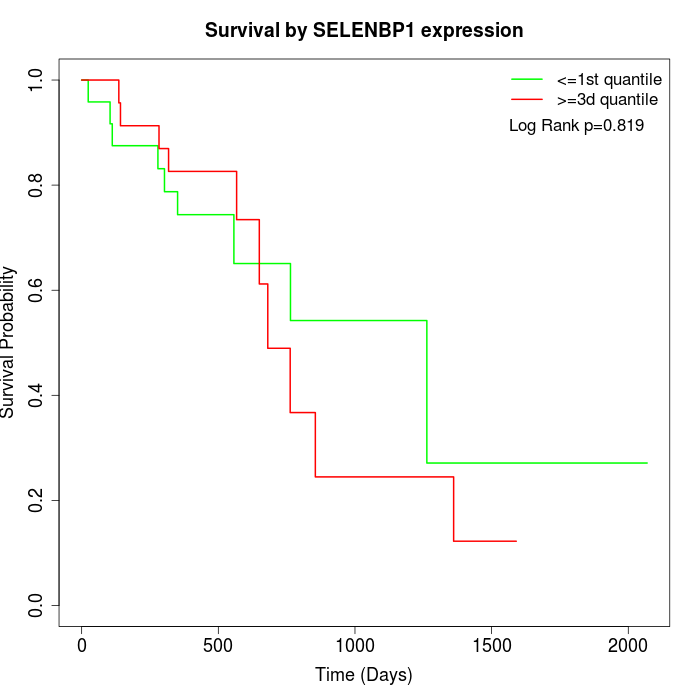 |
| GSE53622 | GSE53624 | TCGA |
Note: Click image to view full size file.
Copy number change of SELENBP1:
| Dataset | Gene | EntrezID | Gain | Loss | Normal | Detail |
|---|---|---|---|---|---|---|
| GSE15526 | SELENBP1 | 8991 | 14 | 0 | 16 | |
| GSE20123 | SELENBP1 | 8991 | 14 | 0 | 16 | |
| GSE43470 | SELENBP1 | 8991 | 6 | 1 | 36 | |
| GSE46452 | SELENBP1 | 8991 | 2 | 1 | 56 | |
| GSE47630 | SELENBP1 | 8991 | 14 | 0 | 26 | |
| GSE54993 | SELENBP1 | 8991 | 0 | 4 | 66 | |
| GSE54994 | SELENBP1 | 8991 | 15 | 0 | 38 | |
| GSE60625 | SELENBP1 | 8991 | 0 | 0 | 11 | |
| GSE74703 | SELENBP1 | 8991 | 6 | 1 | 29 | |
| GSE74704 | SELENBP1 | 8991 | 7 | 0 | 13 | |
| TCGA | SELENBP1 | 8991 | 37 | 2 | 57 |
Total number of gains: 115; Total number of losses: 9; Total Number of normals: 364.
Somatic mutations of SELENBP1:
Generating mutation plots.
Highly correlated genes for SELENBP1:
Showing top 20/1587 corelated genes with mean PCC>0.5.
| Gene1 | Gene2 | Mean PCC | Num. Datasets | Num. PCC<0 | Num. PCC>0.5 |
|---|---|---|---|---|---|
| SELENBP1 | ING3 | 0.816303 | 3 | 0 | 3 |
| SELENBP1 | CLEC3B | 0.81547 | 3 | 0 | 3 |
| SELENBP1 | SORCS1 | 0.806441 | 4 | 0 | 4 |
| SELENBP1 | CYP21A2 | 0.802468 | 3 | 0 | 3 |
| SELENBP1 | GGA3 | 0.791722 | 3 | 0 | 3 |
| SELENBP1 | FRMD3 | 0.759236 | 5 | 0 | 5 |
| SELENBP1 | ARHGEF9 | 0.758457 | 9 | 0 | 9 |
| SELENBP1 | HLF | 0.75423 | 11 | 0 | 11 |
| SELENBP1 | SORBS2 | 0.75243 | 11 | 0 | 11 |
| SELENBP1 | TCEAL6 | 0.749014 | 3 | 0 | 3 |
| SELENBP1 | MACROD2 | 0.748894 | 4 | 0 | 3 |
| SELENBP1 | A2M-AS1 | 0.747245 | 3 | 0 | 3 |
| SELENBP1 | EIF4E3 | 0.7461 | 7 | 0 | 7 |
| SELENBP1 | NR2F1 | 0.745306 | 3 | 0 | 3 |
| SELENBP1 | ZMAT1 | 0.743935 | 6 | 0 | 6 |
| SELENBP1 | PREX2 | 0.743447 | 4 | 0 | 4 |
| SELENBP1 | XKR4 | 0.741207 | 6 | 0 | 5 |
| SELENBP1 | KIAA1143 | 0.739944 | 3 | 0 | 3 |
| SELENBP1 | TNFSF12 | 0.738192 | 3 | 0 | 3 |
| SELENBP1 | CFD | 0.736944 | 9 | 0 | 9 |
For details and further investigation, click here