| Full name: surfactant protein B | Alias Symbol: SP-B | ||
| Type: protein-coding gene | Cytoband: 2p11.2 | ||
| Entrez ID: 6439 | HGNC ID: HGNC:10801 | Ensembl Gene: ENSG00000168878 | OMIM ID: 178640 |
| Related drugs: STREPTOZOTOCIN... [more] | |||
Expression of SFTPB:
| Dataset | Gene | EntrezID | Probe | Log2FC | Adj.pValue | Expression |
|---|---|---|---|---|---|---|
| GSE17351 | SFTPB | 6439 | 214354_x_at | -0.1905 | 0.4589 | |
| GSE20347 | SFTPB | 6439 | 213936_x_at | 0.2434 | 0.1341 | |
| GSE23400 | SFTPB | 6439 | 214354_x_at | -0.1759 | 0.0061 | |
| GSE26886 | SFTPB | 6439 | 213936_x_at | -0.0615 | 0.6949 | |
| GSE29001 | SFTPB | 6439 | 213936_x_at | 0.2371 | 0.2431 | |
| GSE38129 | SFTPB | 6439 | 213936_x_at | 0.0376 | 0.8402 | |
| GSE45670 | SFTPB | 6439 | 213936_x_at | 0.2351 | 0.0237 | |
| GSE53622 | SFTPB | 6439 | 91068 | -1.9249 | 0.0000 | |
| GSE53624 | SFTPB | 6439 | 91068 | -1.4306 | 0.0000 | |
| GSE63941 | SFTPB | 6439 | 213936_x_at | 0.0253 | 0.8979 | |
| GSE77861 | SFTPB | 6439 | 214354_x_at | -0.4199 | 0.0250 | |
| SRP133303 | SFTPB | 6439 | RNAseq | 0.2161 | 0.3690 | |
| SRP219564 | SFTPB | 6439 | RNAseq | 0.3958 | 0.4819 | |
| TCGA | SFTPB | 6439 | RNAseq | 1.5756 | 0.0417 |
Upregulated datasets: 1; Downregulated datasets: 2.
Survival by SFTPB expression:
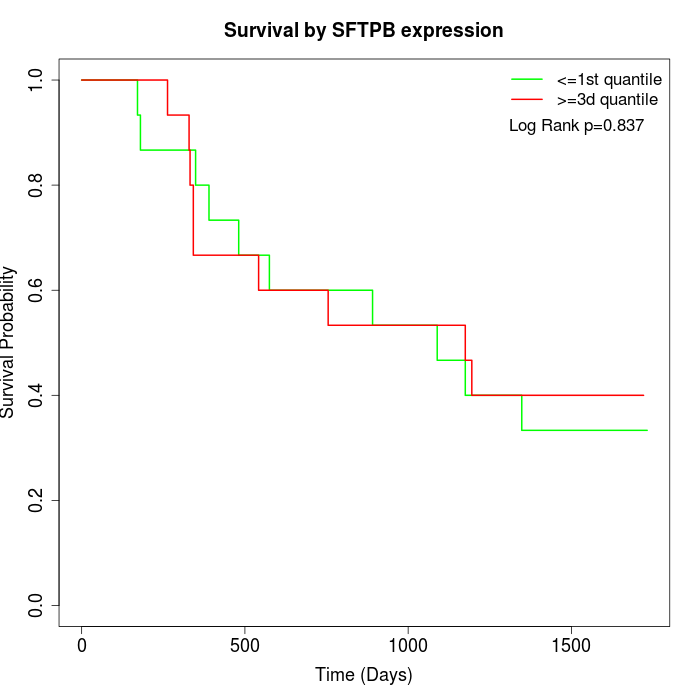 | 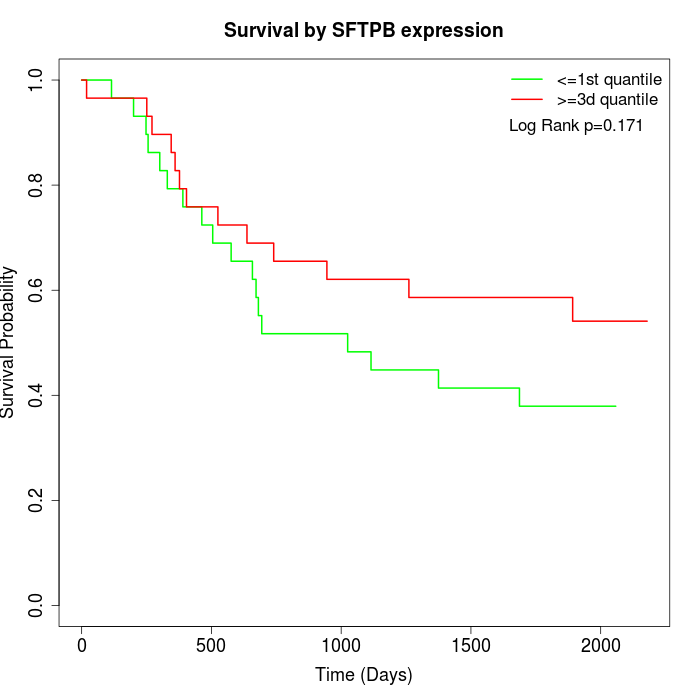 | 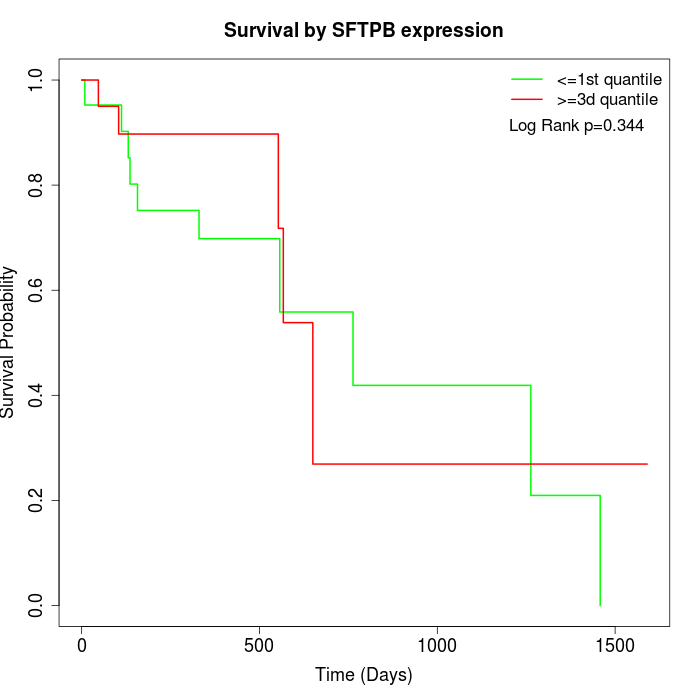 |
| GSE53622 | GSE53624 | TCGA |
Note: Click image to view full size file.
Copy number change of SFTPB:
| Dataset | Gene | EntrezID | Gain | Loss | Normal | Detail |
|---|---|---|---|---|---|---|
| GSE15526 | SFTPB | 6439 | 9 | 2 | 19 | |
| GSE20123 | SFTPB | 6439 | 9 | 2 | 19 | |
| GSE43470 | SFTPB | 6439 | 6 | 2 | 35 | |
| GSE46452 | SFTPB | 6439 | 2 | 3 | 54 | |
| GSE47630 | SFTPB | 6439 | 7 | 0 | 33 | |
| GSE54993 | SFTPB | 6439 | 0 | 6 | 64 | |
| GSE54994 | SFTPB | 6439 | 10 | 0 | 43 | |
| GSE60625 | SFTPB | 6439 | 0 | 3 | 8 | |
| GSE74703 | SFTPB | 6439 | 5 | 1 | 30 | |
| GSE74704 | SFTPB | 6439 | 7 | 0 | 13 | |
| TCGA | SFTPB | 6439 | 35 | 4 | 57 |
Total number of gains: 90; Total number of losses: 23; Total Number of normals: 375.
Somatic mutations of SFTPB:
Generating mutation plots.
Highly correlated genes for SFTPB:
Showing top 20/649 corelated genes with mean PCC>0.5.
| Gene1 | Gene2 | Mean PCC | Num. Datasets | Num. PCC<0 | Num. PCC>0.5 |
|---|---|---|---|---|---|
| SFTPB | LINC00320 | 0.839252 | 3 | 0 | 3 |
| SFTPB | AIF1L | 0.769148 | 4 | 0 | 4 |
| SFTPB | LINC00410 | 0.768851 | 3 | 0 | 3 |
| SFTPB | INE1 | 0.766527 | 3 | 0 | 3 |
| SFTPB | TECPR1 | 0.763432 | 3 | 0 | 3 |
| SFTPB | CPNE6 | 0.762928 | 5 | 0 | 5 |
| SFTPB | VSIG10L | 0.757053 | 4 | 0 | 4 |
| SFTPB | ATG9B | 0.746019 | 4 | 0 | 4 |
| SFTPB | FGFR1 | 0.745313 | 5 | 0 | 5 |
| SFTPB | ABCA5 | 0.74511 | 3 | 0 | 3 |
| SFTPB | MAST4 | 0.742091 | 4 | 0 | 4 |
| SFTPB | MFSD2B | 0.736398 | 3 | 0 | 3 |
| SFTPB | SAMD5 | 0.724624 | 4 | 0 | 4 |
| SFTPB | TRPM3 | 0.719972 | 3 | 0 | 3 |
| SFTPB | ASIC5 | 0.715077 | 3 | 0 | 3 |
| SFTPB | KRT78 | 0.714224 | 4 | 0 | 4 |
| SFTPB | ZNF185 | 0.713927 | 4 | 0 | 4 |
| SFTPB | B3GNT6 | 0.710136 | 3 | 0 | 3 |
| SFTPB | STRADB | 0.708798 | 4 | 0 | 4 |
| SFTPB | CYSRT1 | 0.708756 | 4 | 0 | 4 |
For details and further investigation, click here