| Full name: autophagy related 9B | Alias Symbol: FLJ14885|APG9L2|SONE | ||
| Type: protein-coding gene | Cytoband: 7q36.1 | ||
| Entrez ID: 285973 | HGNC ID: HGNC:21899 | Ensembl Gene: ENSG00000181652 | OMIM ID: 612205 |
Expression of ATG9B:
| Dataset | Gene | EntrezID | Probe | Log2FC | Adj.pValue | Expression |
|---|---|---|---|---|---|---|
| GSE17351 | ATG9B | 285973 | 229252_at | -2.0252 | 0.0945 | |
| GSE26886 | ATG9B | 285973 | 229252_at | -3.3866 | 0.0000 | |
| GSE45670 | ATG9B | 285973 | 229252_at | -1.1999 | 0.0157 | |
| GSE53622 | ATG9B | 285973 | 100800 | -2.3421 | 0.0000 | |
| GSE53624 | ATG9B | 285973 | 100800 | -2.9203 | 0.0000 | |
| GSE63941 | ATG9B | 285973 | 229252_at | -0.0103 | 0.9707 | |
| GSE77861 | ATG9B | 285973 | 229252_at | -1.3681 | 0.0036 | |
| GSE97050 | ATG9B | 285973 | A_32_P154053 | -0.7011 | 0.3023 | |
| SRP007169 | ATG9B | 285973 | RNAseq | -4.4646 | 0.0000 | |
| SRP008496 | ATG9B | 285973 | RNAseq | -4.3957 | 0.0000 | |
| SRP064894 | ATG9B | 285973 | RNAseq | -4.4687 | 0.0000 | |
| SRP133303 | ATG9B | 285973 | RNAseq | -3.5238 | 0.0000 | |
| SRP159526 | ATG9B | 285973 | RNAseq | -3.8768 | 0.0000 | |
| SRP219564 | ATG9B | 285973 | RNAseq | -4.0229 | 0.0000 | |
| TCGA | ATG9B | 285973 | RNAseq | 0.2495 | 0.4195 |
Upregulated datasets: 0; Downregulated datasets: 11.
Survival by ATG9B expression:
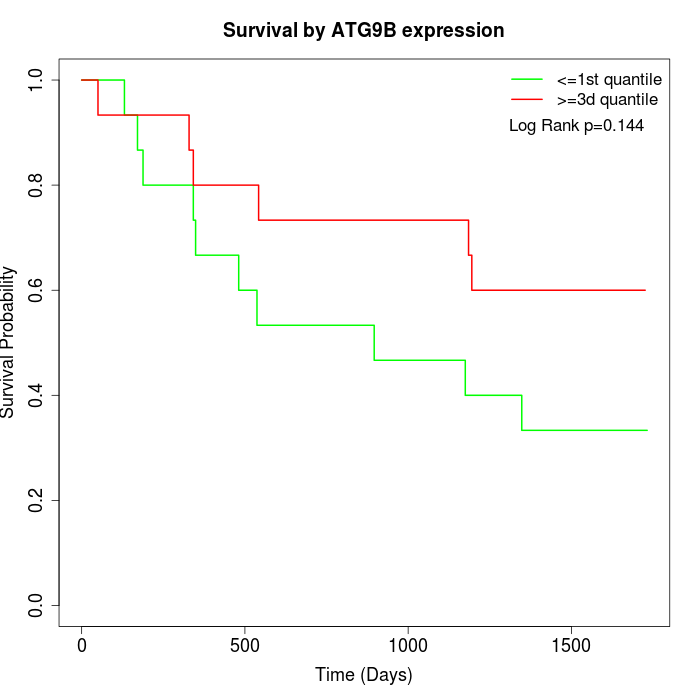 | 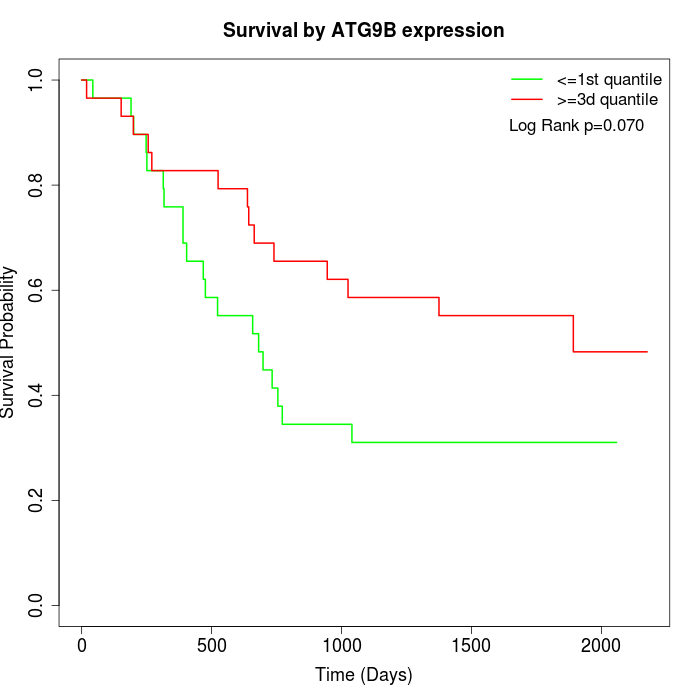 | 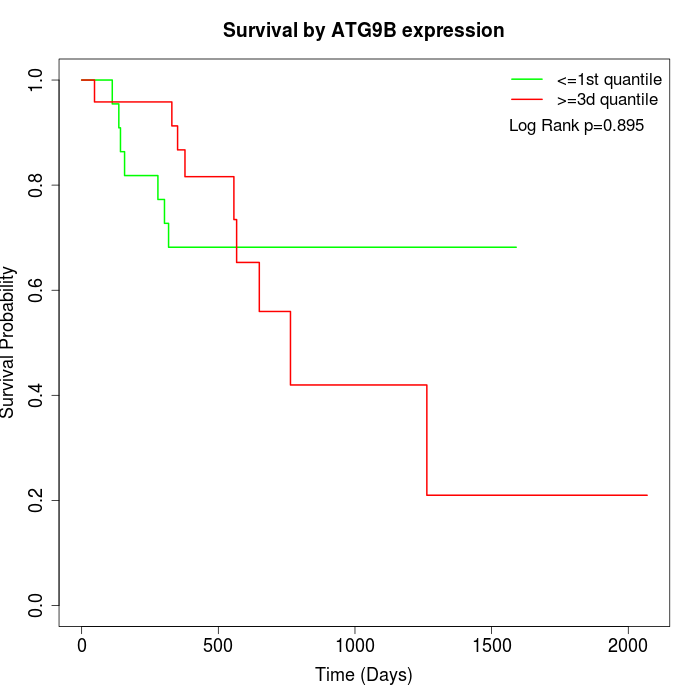 |
| GSE53622 | GSE53624 | TCGA |
Note: Click image to view full size file.
Copy number change of ATG9B:
| Dataset | Gene | EntrezID | Gain | Loss | Normal | Detail |
|---|---|---|---|---|---|---|
| GSE15526 | ATG9B | 285973 | 2 | 4 | 24 | |
| GSE20123 | ATG9B | 285973 | 2 | 4 | 24 | |
| GSE43470 | ATG9B | 285973 | 2 | 5 | 36 | |
| GSE46452 | ATG9B | 285973 | 7 | 2 | 50 | |
| GSE47630 | ATG9B | 285973 | 5 | 9 | 26 | |
| GSE54993 | ATG9B | 285973 | 3 | 3 | 64 | |
| GSE54994 | ATG9B | 285973 | 5 | 8 | 40 | |
| GSE60625 | ATG9B | 285973 | 0 | 0 | 11 | |
| GSE74703 | ATG9B | 285973 | 2 | 4 | 30 | |
| GSE74704 | ATG9B | 285973 | 1 | 4 | 15 | |
| TCGA | ATG9B | 285973 | 25 | 26 | 45 |
Total number of gains: 54; Total number of losses: 69; Total Number of normals: 365.
Somatic mutations of ATG9B:
Generating mutation plots.
Highly correlated genes for ATG9B:
Showing top 20/1557 corelated genes with mean PCC>0.5.
| Gene1 | Gene2 | Mean PCC | Num. Datasets | Num. PCC<0 | Num. PCC>0.5 |
|---|---|---|---|---|---|
| ATG9B | PADI1 | 0.90079 | 4 | 0 | 4 |
| ATG9B | GYS2 | 0.883313 | 6 | 0 | 6 |
| ATG9B | TMEM40 | 0.874471 | 7 | 0 | 7 |
| ATG9B | PSCA | 0.874406 | 4 | 0 | 4 |
| ATG9B | MPZL3 | 0.873571 | 7 | 0 | 7 |
| ATG9B | ENDOU | 0.862498 | 7 | 0 | 7 |
| ATG9B | TTC9 | 0.860532 | 7 | 0 | 7 |
| ATG9B | PTK6 | 0.856209 | 6 | 0 | 6 |
| ATG9B | EPS8L2 | 0.850802 | 6 | 0 | 6 |
| ATG9B | YOD1 | 0.845801 | 7 | 0 | 7 |
| ATG9B | ABLIM3 | 0.841793 | 6 | 0 | 6 |
| ATG9B | C5orf66-AS1 | 0.83701 | 6 | 0 | 6 |
| ATG9B | VSIG10L | 0.83622 | 7 | 0 | 7 |
| ATG9B | FLG | 0.836128 | 7 | 0 | 7 |
| ATG9B | FNDC4 | 0.834343 | 6 | 0 | 6 |
| ATG9B | MAPK3 | 0.832555 | 7 | 0 | 7 |
| ATG9B | C18orf25 | 0.831935 | 7 | 0 | 7 |
| ATG9B | PHACTR4 | 0.830497 | 7 | 0 | 7 |
| ATG9B | ABLIM1 | 0.828515 | 7 | 0 | 7 |
| ATG9B | CYSRT1 | 0.826964 | 7 | 0 | 6 |
For details and further investigation, click here