| Full name: sigma non-opioid intracellular receptor 1 | Alias Symbol: SR-BP1 | ||
| Type: protein-coding gene | Cytoband: 9p13.3 | ||
| Entrez ID: 10280 | HGNC ID: HGNC:8157 | Ensembl Gene: ENSG00000147955 | OMIM ID: 601978 |
| Related drugs: CHEMBL143360, CHEMBL222301, CHEMBL2311194, CHEMBL294144, CHEMBL545050, CITRIC ACID, DEXTROMETHORPHAN, DEXTROMETHORPHAN HYDROBROMIDE MONOHYDRATE, DEXTROMETHORPHAN POLISTIREX, NALTREXONE... [more] | |||
Expression of SIGMAR1:
| Dataset | Gene | EntrezID | Probe | Log2FC | Adj.pValue | Expression |
|---|---|---|---|---|---|---|
| GSE17351 | SIGMAR1 | 10280 | 201692_at | 0.1003 | 0.7497 | |
| GSE20347 | SIGMAR1 | 10280 | 201692_at | 0.1416 | 0.3471 | |
| GSE23400 | SIGMAR1 | 10280 | 201692_at | 0.3348 | 0.0000 | |
| GSE26886 | SIGMAR1 | 10280 | 201692_at | 0.9297 | 0.0000 | |
| GSE29001 | SIGMAR1 | 10280 | 201692_at | 0.3545 | 0.1643 | |
| GSE38129 | SIGMAR1 | 10280 | 201692_at | 0.2452 | 0.0367 | |
| GSE45670 | SIGMAR1 | 10280 | 201692_at | 0.4350 | 0.0378 | |
| GSE53622 | SIGMAR1 | 10280 | 28638 | 0.7123 | 0.0000 | |
| GSE53624 | SIGMAR1 | 10280 | 48651 | 0.5703 | 0.0000 | |
| GSE63941 | SIGMAR1 | 10280 | 201692_at | -0.3502 | 0.4670 | |
| GSE77861 | SIGMAR1 | 10280 | 201692_at | 0.0520 | 0.8789 | |
| GSE97050 | SIGMAR1 | 10280 | A_23_P146637 | 0.1967 | 0.7952 | |
| SRP007169 | SIGMAR1 | 10280 | RNAseq | 0.2849 | 0.5544 | |
| SRP008496 | SIGMAR1 | 10280 | RNAseq | 0.7864 | 0.0362 | |
| SRP064894 | SIGMAR1 | 10280 | RNAseq | 0.7114 | 0.0019 | |
| SRP133303 | SIGMAR1 | 10280 | RNAseq | 0.2553 | 0.0698 | |
| SRP159526 | SIGMAR1 | 10280 | RNAseq | -0.2421 | 0.4205 | |
| SRP193095 | SIGMAR1 | 10280 | RNAseq | 0.1735 | 0.3339 | |
| SRP219564 | SIGMAR1 | 10280 | RNAseq | 0.9009 | 0.0607 | |
| TCGA | SIGMAR1 | 10280 | RNAseq | 0.1391 | 0.0361 |
Upregulated datasets: 0; Downregulated datasets: 0.
Survival by SIGMAR1 expression:
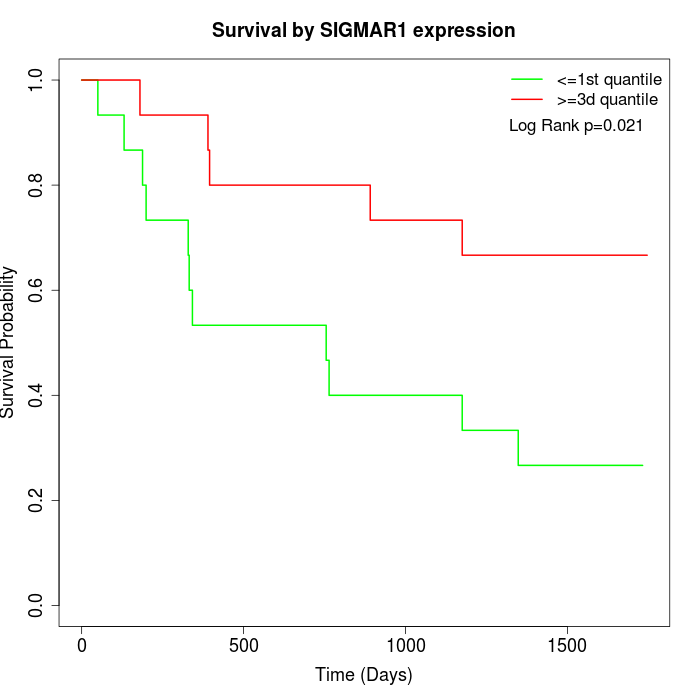 | 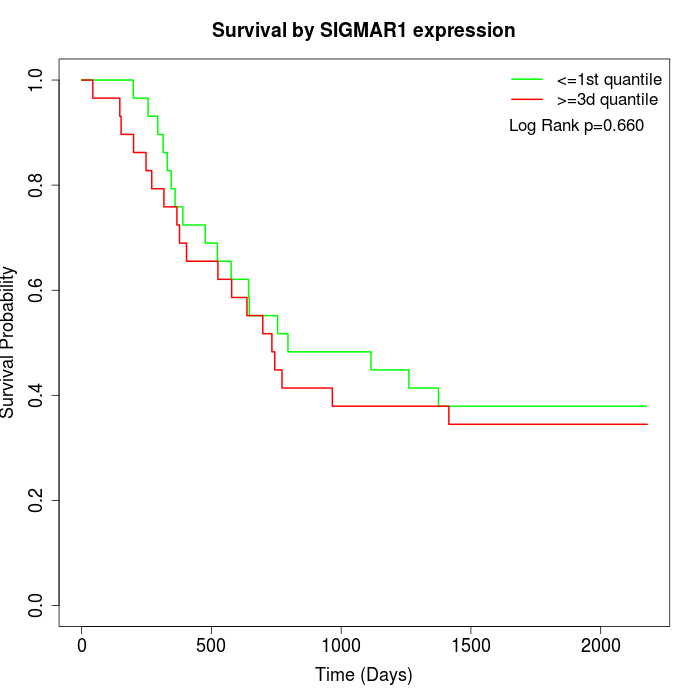 | 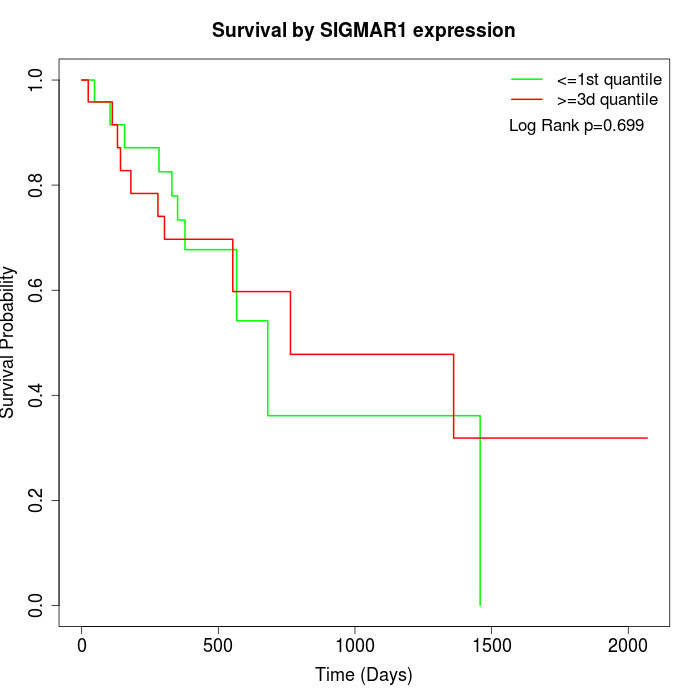 |
| GSE53622 | GSE53624 | TCGA |
Note: Click image to view full size file.
Copy number change of SIGMAR1:
| Dataset | Gene | EntrezID | Gain | Loss | Normal | Detail |
|---|---|---|---|---|---|---|
| GSE15526 | SIGMAR1 | 10280 | 4 | 13 | 13 | |
| GSE20123 | SIGMAR1 | 10280 | 4 | 13 | 13 | |
| GSE43470 | SIGMAR1 | 10280 | 3 | 10 | 30 | |
| GSE46452 | SIGMAR1 | 10280 | 6 | 15 | 38 | |
| GSE47630 | SIGMAR1 | 10280 | 1 | 20 | 19 | |
| GSE54993 | SIGMAR1 | 10280 | 6 | 0 | 64 | |
| GSE54994 | SIGMAR1 | 10280 | 6 | 12 | 35 | |
| GSE60625 | SIGMAR1 | 10280 | 0 | 0 | 11 | |
| GSE74703 | SIGMAR1 | 10280 | 2 | 7 | 27 | |
| GSE74704 | SIGMAR1 | 10280 | 0 | 11 | 9 | |
| TCGA | SIGMAR1 | 10280 | 17 | 44 | 35 |
Total number of gains: 49; Total number of losses: 145; Total Number of normals: 294.
Somatic mutations of SIGMAR1:
Generating mutation plots.
Highly correlated genes for SIGMAR1:
Showing top 20/410 corelated genes with mean PCC>0.5.
| Gene1 | Gene2 | Mean PCC | Num. Datasets | Num. PCC<0 | Num. PCC>0.5 |
|---|---|---|---|---|---|
| SIGMAR1 | MIIP | 0.663423 | 3 | 0 | 3 |
| SIGMAR1 | KNSTRN | 0.660887 | 4 | 0 | 4 |
| SIGMAR1 | KIF26B | 0.644604 | 4 | 0 | 4 |
| SIGMAR1 | FANCG | 0.641521 | 11 | 0 | 10 |
| SIGMAR1 | PNPT1 | 0.638918 | 3 | 0 | 3 |
| SIGMAR1 | NOL6 | 0.638582 | 12 | 0 | 9 |
| SIGMAR1 | NTMT1 | 0.633841 | 5 | 0 | 3 |
| SIGMAR1 | RTKN | 0.627779 | 5 | 0 | 4 |
| SIGMAR1 | BOLA3 | 0.625864 | 5 | 0 | 5 |
| SIGMAR1 | EEF1E1 | 0.625504 | 5 | 0 | 4 |
| SIGMAR1 | EXOSC3 | 0.624747 | 7 | 0 | 6 |
| SIGMAR1 | CORO7 | 0.624613 | 4 | 0 | 3 |
| SIGMAR1 | C1QTNF6 | 0.623034 | 4 | 0 | 3 |
| SIGMAR1 | TOMM5 | 0.622935 | 5 | 0 | 4 |
| SIGMAR1 | UBE2T | 0.622429 | 4 | 0 | 4 |
| SIGMAR1 | MPLKIP | 0.621837 | 3 | 0 | 3 |
| SIGMAR1 | ATXN7L2 | 0.62114 | 3 | 0 | 3 |
| SIGMAR1 | NSMF | 0.620794 | 3 | 0 | 3 |
| SIGMAR1 | PRPF8 | 0.614868 | 5 | 0 | 4 |
| SIGMAR1 | NPM3 | 0.613346 | 9 | 0 | 8 |
For details and further investigation, click here