| Full name: Src like adaptor 2 | Alias Symbol: FLJ21992|SLAP-2 | ||
| Type: protein-coding gene | Cytoband: 20q11.23 | ||
| Entrez ID: 84174 | HGNC ID: HGNC:17329 | Ensembl Gene: ENSG00000101082 | OMIM ID: 606577 |
Expression of SLA2:
| Dataset | Gene | EntrezID | Probe | Log2FC | Adj.pValue | Expression |
|---|---|---|---|---|---|---|
| GSE17351 | SLA2 | 84174 | 232234_at | 0.3249 | 0.6060 | |
| GSE26886 | SLA2 | 84174 | 1555688_s_at | -0.0399 | 0.7507 | |
| GSE45670 | SLA2 | 84174 | 232234_at | 0.2124 | 0.1714 | |
| GSE53622 | SLA2 | 84174 | 20275 | 0.0556 | 0.6277 | |
| GSE53624 | SLA2 | 84174 | 20275 | -0.0182 | 0.8402 | |
| GSE63941 | SLA2 | 84174 | 1555688_s_at | -0.0917 | 0.6031 | |
| GSE77861 | SLA2 | 84174 | 232234_at | -0.0373 | 0.7296 | |
| GSE97050 | SLA2 | 84174 | A_23_P143173 | 0.4573 | 0.2719 | |
| SRP064894 | SLA2 | 84174 | RNAseq | 0.1272 | 0.6654 | |
| SRP133303 | SLA2 | 84174 | RNAseq | -0.3412 | 0.1295 | |
| SRP159526 | SLA2 | 84174 | RNAseq | -0.4422 | 0.6315 | |
| SRP193095 | SLA2 | 84174 | RNAseq | -0.1527 | 0.3011 | |
| SRP219564 | SLA2 | 84174 | RNAseq | 0.5832 | 0.3805 | |
| TCGA | SLA2 | 84174 | RNAseq | 0.1031 | 0.7174 |
Upregulated datasets: 0; Downregulated datasets: 0.
Survival by SLA2 expression:
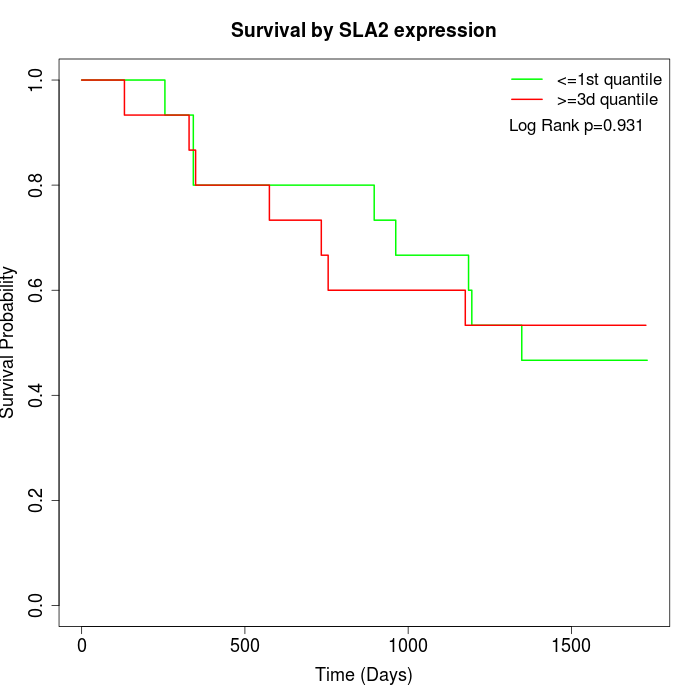 | 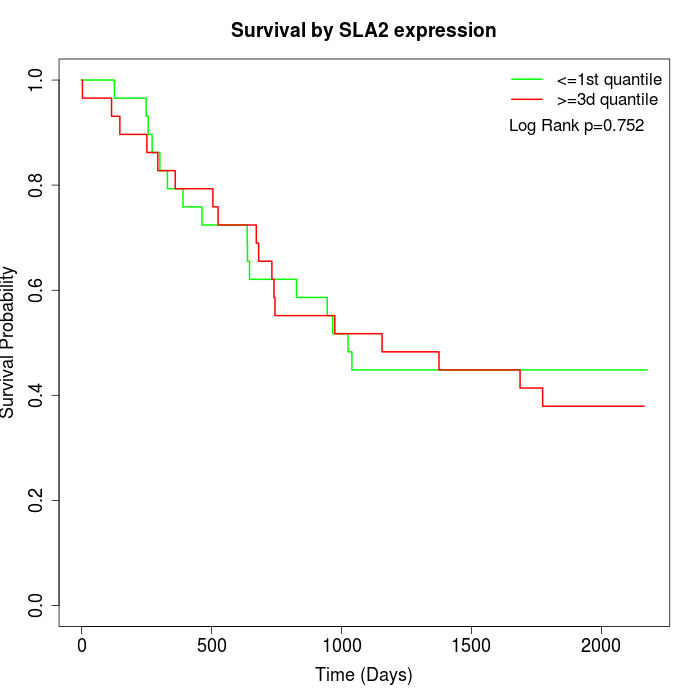 | 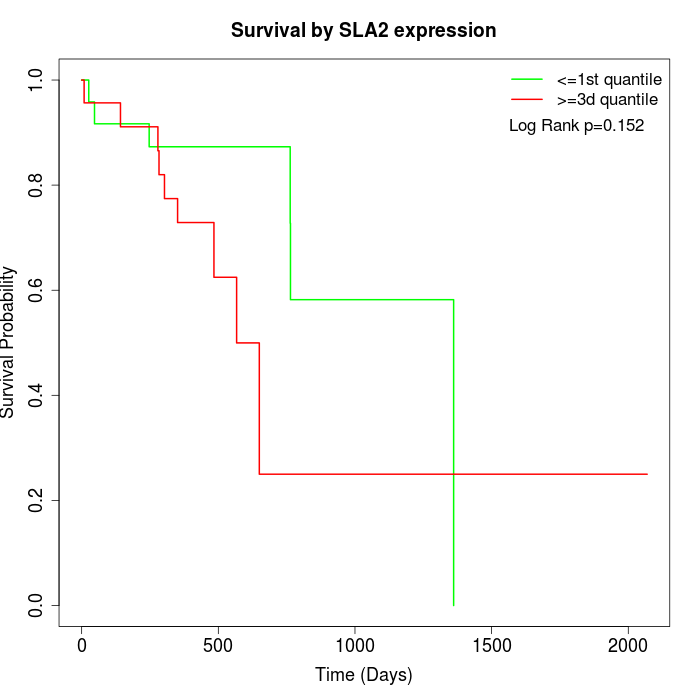 |
| GSE53622 | GSE53624 | TCGA |
Note: Click image to view full size file.
Copy number change of SLA2:
| Dataset | Gene | EntrezID | Gain | Loss | Normal | Detail |
|---|---|---|---|---|---|---|
| GSE15526 | SLA2 | 84174 | 14 | 2 | 14 | |
| GSE20123 | SLA2 | 84174 | 14 | 2 | 14 | |
| GSE43470 | SLA2 | 84174 | 12 | 0 | 31 | |
| GSE46452 | SLA2 | 84174 | 29 | 0 | 30 | |
| GSE47630 | SLA2 | 84174 | 24 | 0 | 16 | |
| GSE54993 | SLA2 | 84174 | 0 | 17 | 53 | |
| GSE54994 | SLA2 | 84174 | 24 | 0 | 29 | |
| GSE60625 | SLA2 | 84174 | 0 | 0 | 11 | |
| GSE74703 | SLA2 | 84174 | 11 | 0 | 25 | |
| GSE74704 | SLA2 | 84174 | 10 | 1 | 9 | |
| TCGA | SLA2 | 84174 | 49 | 3 | 44 |
Total number of gains: 187; Total number of losses: 25; Total Number of normals: 276.
Somatic mutations of SLA2:
Generating mutation plots.
Highly correlated genes for SLA2:
Showing top 20/93 corelated genes with mean PCC>0.5.
| Gene1 | Gene2 | Mean PCC | Num. Datasets | Num. PCC<0 | Num. PCC>0.5 |
|---|---|---|---|---|---|
| SLA2 | TNFSF13B | 0.793861 | 3 | 0 | 3 |
| SLA2 | CFB | 0.785836 | 3 | 0 | 3 |
| SLA2 | ORM1 | 0.713308 | 3 | 0 | 3 |
| SLA2 | SUN5 | 0.699036 | 4 | 0 | 3 |
| SLA2 | EVI2A | 0.696509 | 3 | 0 | 3 |
| SLA2 | SIGLEC10 | 0.688553 | 4 | 0 | 4 |
| SLA2 | GPR171 | 0.687304 | 3 | 0 | 3 |
| SLA2 | CHI3L2 | 0.685349 | 3 | 0 | 3 |
| SLA2 | FCGR1B | 0.683783 | 4 | 0 | 3 |
| SLA2 | RAB3IL1 | 0.681748 | 4 | 0 | 4 |
| SLA2 | WAS | 0.667309 | 5 | 0 | 4 |
| SLA2 | DENND1C | 0.664468 | 6 | 0 | 6 |
| SLA2 | CD3G | 0.663584 | 6 | 0 | 5 |
| SLA2 | CD3E | 0.662641 | 5 | 0 | 4 |
| SLA2 | IL21R | 0.660675 | 5 | 0 | 5 |
| SLA2 | PTPRCAP | 0.646609 | 3 | 0 | 3 |
| SLA2 | IL2RB | 0.645945 | 4 | 0 | 3 |
| SLA2 | JAKMIP1 | 0.644104 | 4 | 0 | 3 |
| SLA2 | CCDC62 | 0.643914 | 3 | 0 | 3 |
| SLA2 | CD8A | 0.643498 | 6 | 0 | 5 |
For details and further investigation, click here