| Full name: pleiotrophin | Alias Symbol: HBNF|HBGF8 | ||
| Type: protein-coding gene | Cytoband: 7q33 | ||
| Entrez ID: 5764 | HGNC ID: HGNC:9630 | Ensembl Gene: ENSG00000105894 | OMIM ID: 162095 |
Expression of PTN:
| Dataset | Gene | EntrezID | Probe | Log2FC | Adj.pValue | Expression |
|---|---|---|---|---|---|---|
| GSE17351 | PTN | 5764 | 211737_x_at | -3.7085 | 0.0036 | |
| GSE20347 | PTN | 5764 | 211737_x_at | -2.8420 | 0.0000 | |
| GSE23400 | PTN | 5764 | 211737_x_at | -1.3995 | 0.0000 | |
| GSE26886 | PTN | 5764 | 211737_x_at | -2.8382 | 0.0002 | |
| GSE29001 | PTN | 5764 | 211737_x_at | -3.3371 | 0.0001 | |
| GSE38129 | PTN | 5764 | 211737_x_at | -2.3214 | 0.0000 | |
| GSE45670 | PTN | 5764 | 211737_x_at | -2.0775 | 0.0050 | |
| GSE63941 | PTN | 5764 | 209466_x_at | -5.5855 | 0.0000 | |
| GSE77861 | PTN | 5764 | 211737_x_at | -1.5236 | 0.0005 | |
| GSE97050 | PTN | 5764 | A_24_P870620 | -0.5520 | 0.3618 | |
| SRP007169 | PTN | 5764 | RNAseq | -1.2896 | 0.0906 | |
| SRP064894 | PTN | 5764 | RNAseq | -1.4381 | 0.0000 | |
| SRP133303 | PTN | 5764 | RNAseq | -1.6844 | 0.0000 | |
| SRP159526 | PTN | 5764 | RNAseq | -1.2537 | 0.0092 | |
| SRP193095 | PTN | 5764 | RNAseq | -2.5314 | 0.0000 | |
| SRP219564 | PTN | 5764 | RNAseq | -1.8803 | 0.0033 | |
| TCGA | PTN | 5764 | RNAseq | -0.0328 | 0.8789 |
Upregulated datasets: 0; Downregulated datasets: 14.
Survival by PTN expression:
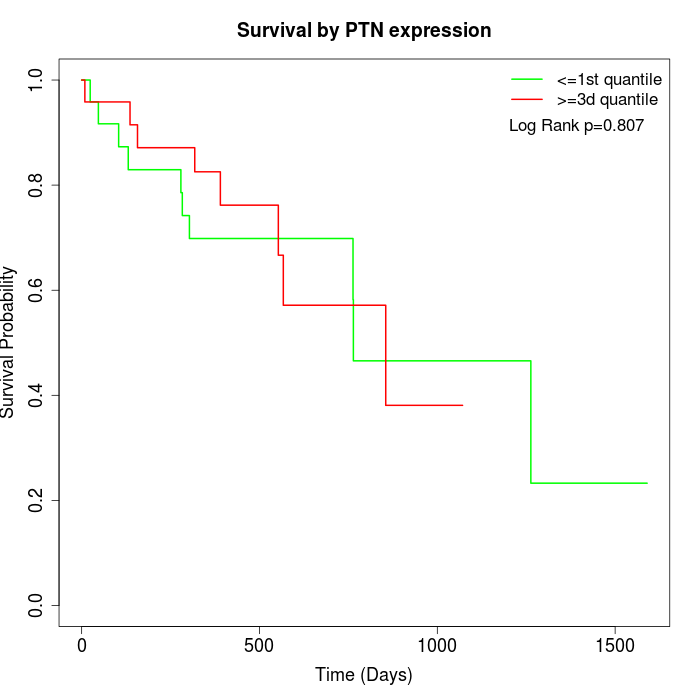 |
| TCGA |
Note: Click image to view full size file.
Copy number change of PTN:
| Dataset | Gene | EntrezID | Gain | Loss | Normal | Detail |
|---|---|---|---|---|---|---|
| GSE15526 | PTN | 5764 | 5 | 1 | 24 | |
| GSE20123 | PTN | 5764 | 5 | 1 | 24 | |
| GSE43470 | PTN | 5764 | 2 | 3 | 38 | |
| GSE46452 | PTN | 5764 | 7 | 2 | 50 | |
| GSE47630 | PTN | 5764 | 7 | 4 | 29 | |
| GSE54993 | PTN | 5764 | 3 | 5 | 62 | |
| GSE54994 | PTN | 5764 | 6 | 8 | 39 | |
| GSE60625 | PTN | 5764 | 0 | 0 | 11 | |
| GSE74703 | PTN | 5764 | 2 | 3 | 31 | |
| GSE74704 | PTN | 5764 | 2 | 1 | 17 | |
| TCGA | PTN | 5764 | 28 | 23 | 45 |
Total number of gains: 67; Total number of losses: 51; Total Number of normals: 370.
Somatic mutations of PTN:
Generating mutation plots.
Highly correlated genes for PTN:
Showing top 20/1087 corelated genes with mean PCC>0.5.
| Gene1 | Gene2 | Mean PCC | Num. Datasets | Num. PCC<0 | Num. PCC>0.5 |
|---|---|---|---|---|---|
| PTN | SH3BGRL2 | 0.86436 | 5 | 0 | 5 |
| PTN | SAMD5 | 0.857641 | 5 | 0 | 5 |
| PTN | PAQR8 | 0.795616 | 5 | 0 | 5 |
| PTN | FAM214A | 0.792375 | 4 | 0 | 4 |
| PTN | CTTNBP2 | 0.787389 | 6 | 0 | 5 |
| PTN | SMDT1 | 0.784172 | 4 | 0 | 3 |
| PTN | FAM3D | 0.779426 | 5 | 0 | 5 |
| PTN | KRT78 | 0.777051 | 5 | 0 | 5 |
| PTN | CCBE1 | 0.771526 | 3 | 0 | 3 |
| PTN | SFTA2 | 0.762335 | 4 | 0 | 4 |
| PTN | CRISP3 | 0.75983 | 9 | 0 | 9 |
| PTN | MGST2 | 0.758672 | 9 | 0 | 9 |
| PTN | ZNF536 | 0.755898 | 3 | 0 | 3 |
| PTN | ARHGAP20 | 0.755836 | 3 | 0 | 3 |
| PTN | SPAG17 | 0.753554 | 5 | 0 | 5 |
| PTN | RRAGD | 0.752076 | 9 | 0 | 9 |
| PTN | UBL3 | 0.751086 | 9 | 0 | 9 |
| PTN | SASH1 | 0.745222 | 10 | 0 | 10 |
| PTN | GALNT12 | 0.745191 | 9 | 0 | 9 |
| PTN | LINC00557 | 0.744306 | 3 | 0 | 3 |
For details and further investigation, click here