| Full name: synaptotagmin 15 | Alias Symbol: CHR10SYT | ||
| Type: protein-coding gene | Cytoband: 10q11.22 | ||
| Entrez ID: 83849 | HGNC ID: HGNC:17167 | Ensembl Gene: ENSG00000204176 | OMIM ID: 608081 |
Screen Evidence:
| |||
Expression of SYT15:
| Dataset | Gene | EntrezID | Probe | Log2FC | Adj.pValue | Expression |
|---|---|---|---|---|---|---|
| GSE17351 | SYT15 | 83849 | 1560878_at | -0.0521 | 0.8327 | |
| GSE26886 | SYT15 | 83849 | 1560878_at | -0.0411 | 0.8768 | |
| GSE45670 | SYT15 | 83849 | 1560878_at | -0.1045 | 0.2685 | |
| GSE63941 | SYT15 | 83849 | 1560878_at | 0.3668 | 0.0241 | |
| GSE77861 | SYT15 | 83849 | 1560878_at | -0.0406 | 0.7846 | |
| GSE97050 | SYT15 | 83849 | A_33_P3353979 | -0.4150 | 0.2635 | |
| SRP007169 | SYT15 | 83849 | RNAseq | -5.3519 | 0.0000 | |
| SRP064894 | SYT15 | 83849 | RNAseq | -1.5714 | 0.0000 | |
| SRP133303 | SYT15 | 83849 | RNAseq | -0.8599 | 0.0002 | |
| SRP159526 | SYT15 | 83849 | RNAseq | -2.0168 | 0.0001 | |
| SRP193095 | SYT15 | 83849 | RNAseq | -0.8964 | 0.0000 | |
| SRP219564 | SYT15 | 83849 | RNAseq | -0.9190 | 0.0055 | |
| TCGA | SYT15 | 83849 | RNAseq | -0.4742 | 0.0293 |
Upregulated datasets: 0; Downregulated datasets: 3.
Survival by SYT15 expression:
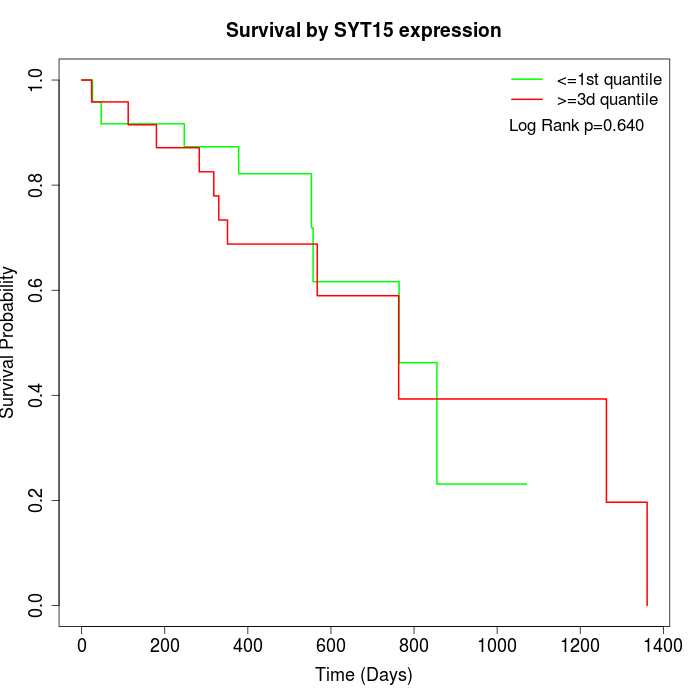 |
| TCGA |
Note: Click image to view full size file.
Copy number change of SYT15:
| Dataset | Gene | EntrezID | Gain | Loss | Normal | Detail |
|---|---|---|---|---|---|---|
| GSE15526 | SYT15 | 83849 | 3 | 5 | 22 | |
| GSE20123 | SYT15 | 83849 | 3 | 5 | 22 | |
| GSE43470 | SYT15 | 83849 | 2 | 6 | 35 | |
| GSE46452 | SYT15 | 83849 | 0 | 13 | 46 | |
| GSE47630 | SYT15 | 83849 | 4 | 12 | 24 | |
| GSE54993 | SYT15 | 83849 | 9 | 0 | 61 | |
| GSE54994 | SYT15 | 83849 | 2 | 10 | 41 | |
| GSE60625 | SYT15 | 83849 | 0 | 0 | 11 | |
| GSE74703 | SYT15 | 83849 | 2 | 3 | 31 | |
| GSE74704 | SYT15 | 83849 | 2 | 4 | 14 | |
| TCGA | SYT15 | 83849 | 16 | 18 | 62 |
Total number of gains: 43; Total number of losses: 76; Total Number of normals: 369.
Somatic mutations of SYT15:
Generating mutation plots.
Highly correlated genes for SYT15:
Showing top 20/80 corelated genes with mean PCC>0.5.
| Gene1 | Gene2 | Mean PCC | Num. Datasets | Num. PCC<0 | Num. PCC>0.5 |
|---|---|---|---|---|---|
| SYT15 | GNAO1 | 0.735364 | 3 | 0 | 3 |
| SYT15 | MVB12A | 0.670361 | 3 | 0 | 3 |
| SYT15 | RNF167 | 0.669978 | 4 | 0 | 3 |
| SYT15 | POM121L12 | 0.668832 | 4 | 0 | 4 |
| SYT15 | GSTM1 | 0.656473 | 3 | 0 | 3 |
| SYT15 | FIZ1 | 0.655939 | 4 | 0 | 4 |
| SYT15 | SLC5A2 | 0.654964 | 3 | 0 | 3 |
| SYT15 | RALGPS1 | 0.648036 | 3 | 0 | 3 |
| SYT15 | HPX | 0.645255 | 3 | 0 | 3 |
| SYT15 | SCAF1 | 0.643218 | 4 | 0 | 4 |
| SYT15 | PTGIR | 0.633086 | 4 | 0 | 3 |
| SYT15 | IL34 | 0.631417 | 3 | 0 | 3 |
| SYT15 | MYOZ3 | 0.624282 | 5 | 0 | 4 |
| SYT15 | WBP2 | 0.62204 | 3 | 0 | 3 |
| SYT15 | NANOG | 0.619954 | 3 | 0 | 3 |
| SYT15 | PNPLA2 | 0.619098 | 4 | 0 | 3 |
| SYT15 | FHAD1 | 0.614792 | 3 | 0 | 3 |
| SYT15 | LKAAEAR1 | 0.613741 | 4 | 0 | 3 |
| SYT15 | PPP1R27 | 0.612625 | 4 | 0 | 3 |
| SYT15 | E2F4 | 0.611868 | 4 | 0 | 3 |
For details and further investigation, click here