| Full name: glutathione S-transferase mu 1 | Alias Symbol: MU|H-B | ||
| Type: protein-coding gene | Cytoband: 1p13.3 | ||
| Entrez ID: 2944 | HGNC ID: HGNC:4632 | Ensembl Gene: ENSG00000134184 | OMIM ID: 138350 |
| Related drugs: CHLORAMBUCIL, CURCUMIN, DICUMAROL, DOCETAXEL, IRINOTECAN, LUTEIN, METHOTREXATE, NITROGLYCERIN, PREDNISONE, SULFORAPHANE... [more] | |||
Expression of GSTM1:
| Dataset | Gene | EntrezID | Probe | Log2FC | Adj.pValue | Expression |
|---|---|---|---|---|---|---|
| GSE17351 | GSTM1 | 2944 | 215333_x_at | 0.0044 | 0.9971 | |
| GSE20347 | GSTM1 | 2944 | 215333_x_at | 0.4085 | 0.3560 | |
| GSE23400 | GSTM1 | 2944 | 204550_x_at | 0.1978 | 0.3983 | |
| GSE26886 | GSTM1 | 2944 | 215333_x_at | 0.1724 | 0.7489 | |
| GSE29001 | GSTM1 | 2944 | 215333_x_at | -0.0770 | 0.8679 | |
| GSE38129 | GSTM1 | 2944 | 204550_x_at | 0.3342 | 0.3568 | |
| GSE45670 | GSTM1 | 2944 | 215333_x_at | -0.6557 | 0.0975 | |
| GSE53622 | GSTM1 | 2944 | 45970 | -0.2271 | 0.2733 | |
| GSE53624 | GSTM1 | 2944 | 45970 | -0.0673 | 0.6963 | |
| GSE63941 | GSTM1 | 2944 | 215333_x_at | -0.1203 | 0.9238 | |
| GSE77861 | GSTM1 | 2944 | 204550_x_at | -0.1283 | 0.9357 | |
| GSE97050 | GSTM1 | 2944 | A_23_P115407 | -0.8340 | 0.1811 | |
| TCGA | GSTM1 | 2944 | RNAseq | 0.5517 | 0.5924 |
Upregulated datasets: 0; Downregulated datasets: 0.
Survival by GSTM1 expression:
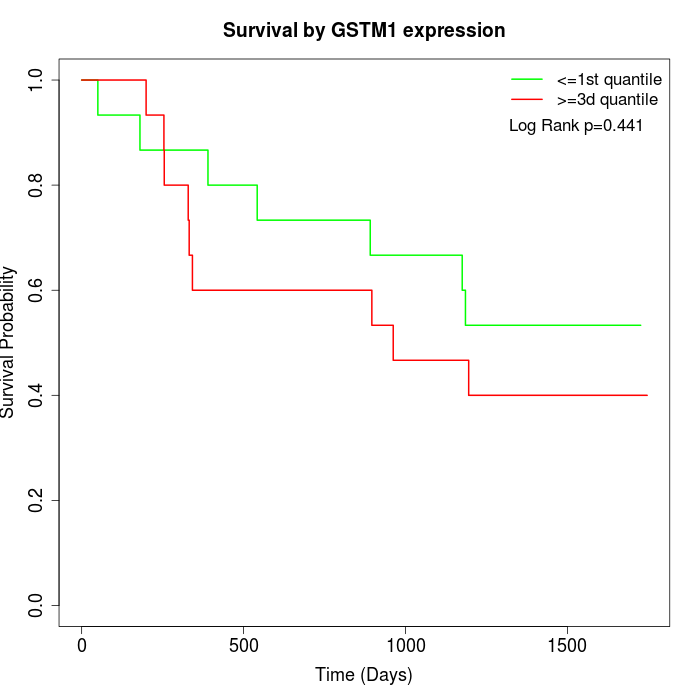 | 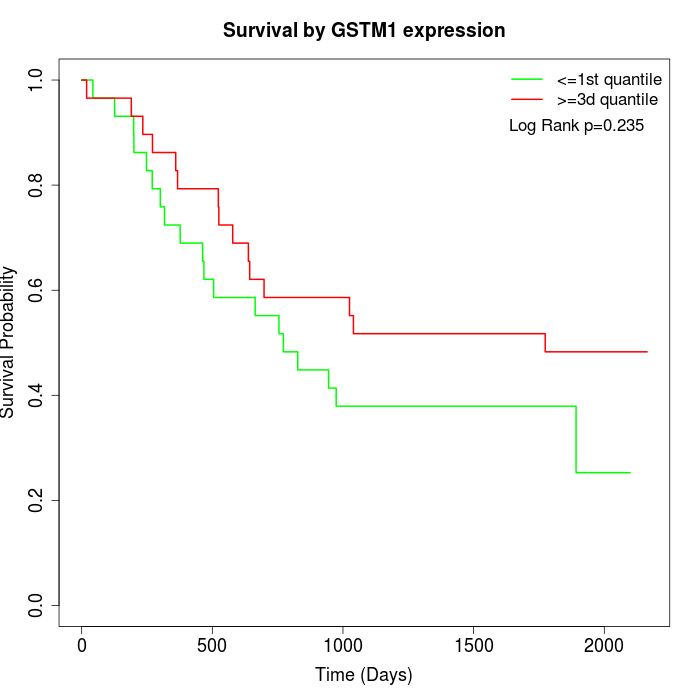 | 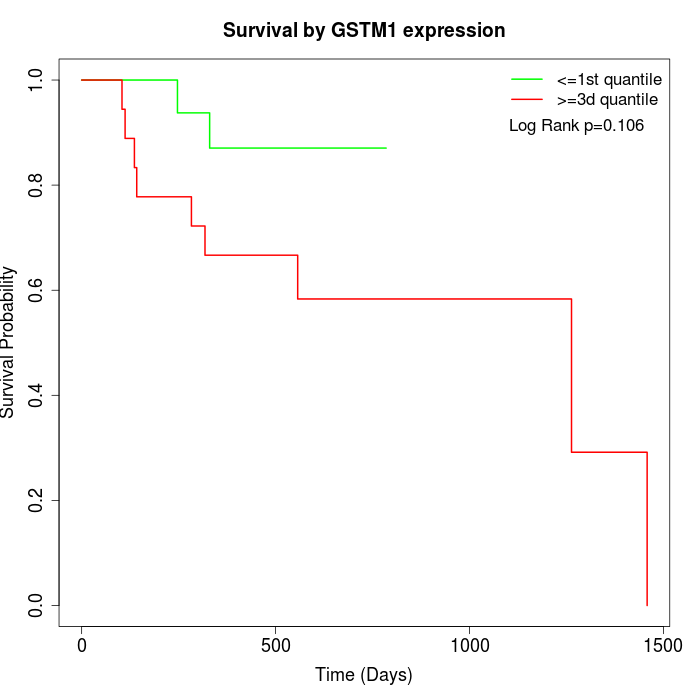 |
| GSE53622 | GSE53624 | TCGA |
Note: Click image to view full size file.
Copy number change of GSTM1:
| Dataset | Gene | EntrezID | Gain | Loss | Normal | Detail |
|---|---|---|---|---|---|---|
| GSE15526 | GSTM1 | 2944 | 0 | 12 | 18 | |
| GSE20123 | GSTM1 | 2944 | 0 | 11 | 19 | |
| GSE43470 | GSTM1 | 2944 | 0 | 9 | 34 | |
| GSE46452 | GSTM1 | 2944 | 2 | 1 | 56 | |
| GSE47630 | GSTM1 | 2944 | 9 | 5 | 26 | |
| GSE54993 | GSTM1 | 2944 | 0 | 1 | 69 | |
| GSE54994 | GSTM1 | 2944 | 7 | 4 | 42 | |
| GSE60625 | GSTM1 | 2944 | 0 | 0 | 11 | |
| GSE74703 | GSTM1 | 2944 | 0 | 7 | 29 | |
| GSE74704 | GSTM1 | 2944 | 0 | 7 | 13 | |
| TCGA | GSTM1 | 2944 | 9 | 26 | 61 |
Total number of gains: 27; Total number of losses: 83; Total Number of normals: 378.
Somatic mutations of GSTM1:
Generating mutation plots.
Highly correlated genes for GSTM1:
Showing top 20/52 corelated genes with mean PCC>0.5.
| Gene1 | Gene2 | Mean PCC | Num. Datasets | Num. PCC<0 | Num. PCC>0.5 |
|---|---|---|---|---|---|
| GSTM1 | GSTM2 | 0.948241 | 13 | 0 | 13 |
| GSTM1 | GSTM4 | 0.710871 | 13 | 0 | 13 |
| GSTM1 | SYT15 | 0.656473 | 3 | 0 | 3 |
| GSTM1 | MTTP | 0.654692 | 3 | 0 | 3 |
| GSTM1 | GSTM3 | 0.65141 | 12 | 0 | 11 |
| GSTM1 | PRKCG | 0.643193 | 3 | 0 | 3 |
| GSTM1 | KCNC1 | 0.640062 | 3 | 0 | 3 |
| GSTM1 | LRRTM1 | 0.639892 | 3 | 0 | 3 |
| GSTM1 | SMARCA1 | 0.630707 | 3 | 0 | 3 |
| GSTM1 | HS1BP3 | 0.629386 | 3 | 0 | 3 |
| GSTM1 | RIMKLA | 0.628952 | 3 | 0 | 3 |
| GSTM1 | KY | 0.62778 | 3 | 0 | 3 |
| GSTM1 | UCN3 | 0.624895 | 4 | 0 | 4 |
| GSTM1 | REM1 | 0.612364 | 4 | 0 | 3 |
| GSTM1 | SYNGR1 | 0.598002 | 3 | 0 | 3 |
| GSTM1 | ZNF470 | 0.597773 | 3 | 0 | 3 |
| GSTM1 | NDUFB10 | 0.588716 | 3 | 0 | 3 |
| GSTM1 | TBC1D17 | 0.582629 | 3 | 0 | 3 |
| GSTM1 | BHMT | 0.577954 | 3 | 0 | 3 |
| GSTM1 | KCNA2 | 0.575099 | 3 | 0 | 3 |
For details and further investigation, click here