| Full name: tachykinin receptor 3 | Alias Symbol: NK3R|NKR|TAC3R | ||
| Type: protein-coding gene | Cytoband: 4q24 | ||
| Entrez ID: 6870 | HGNC ID: HGNC:11528 | Ensembl Gene: ENSG00000169836 | OMIM ID: 162332 |
| Related drugs: AMCINONIDE, AZD2624, CHEMBL1991816, CHEMBL221445, CHEMBL275544, CHEMBL44229, CHEMBL480249, CHEMBL69367, CHEMBL9843, ELEDOISIN... [more] | |||
TACR3 involved pathways:
| KEGG pathway | Description | View |
|---|---|---|
| hsa04020 | Calcium signaling pathway |
Expression of TACR3:
| Dataset | Gene | EntrezID | Probe | Log2FC | Adj.pValue | Expression |
|---|---|---|---|---|---|---|
| GSE17351 | TACR3 | 6870 | 208183_at | -0.0215 | 0.9479 | |
| GSE20347 | TACR3 | 6870 | 208183_at | 0.0622 | 0.4500 | |
| GSE23400 | TACR3 | 6870 | 208183_at | -0.1105 | 0.0021 | |
| GSE26886 | TACR3 | 6870 | 208183_at | 0.1073 | 0.4739 | |
| GSE29001 | TACR3 | 6870 | 208183_at | 0.0352 | 0.7665 | |
| GSE38129 | TACR3 | 6870 | 208183_at | -0.0720 | 0.4206 | |
| GSE45670 | TACR3 | 6870 | 208183_at | 0.1024 | 0.2443 | |
| GSE53622 | TACR3 | 6870 | 52503 | -0.2114 | 0.2740 | |
| GSE53624 | TACR3 | 6870 | 52503 | 0.0750 | 0.5270 | |
| GSE63941 | TACR3 | 6870 | 208183_at | 0.1650 | 0.2604 | |
| GSE77861 | TACR3 | 6870 | 208183_at | -0.0324 | 0.8149 | |
| TCGA | TACR3 | 6870 | RNAseq | 2.0609 | 0.1450 |
Upregulated datasets: 0; Downregulated datasets: 0.
Survival by TACR3 expression:
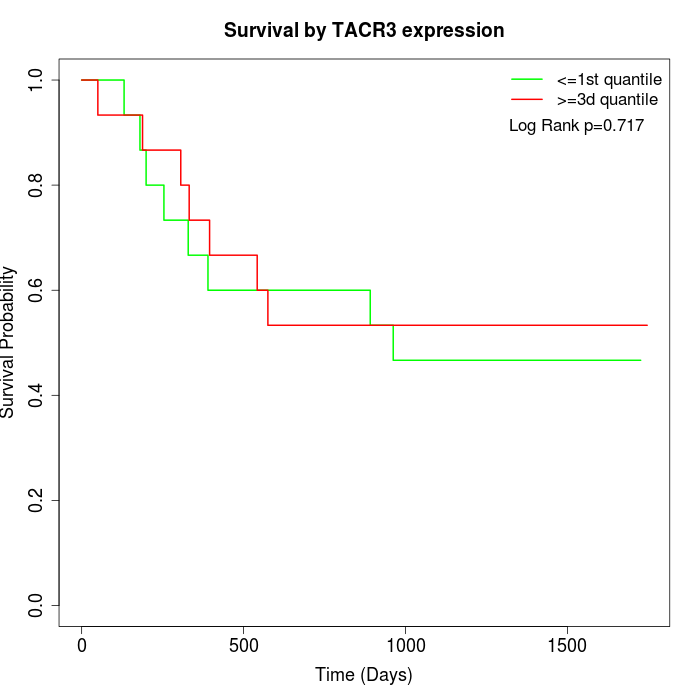 | 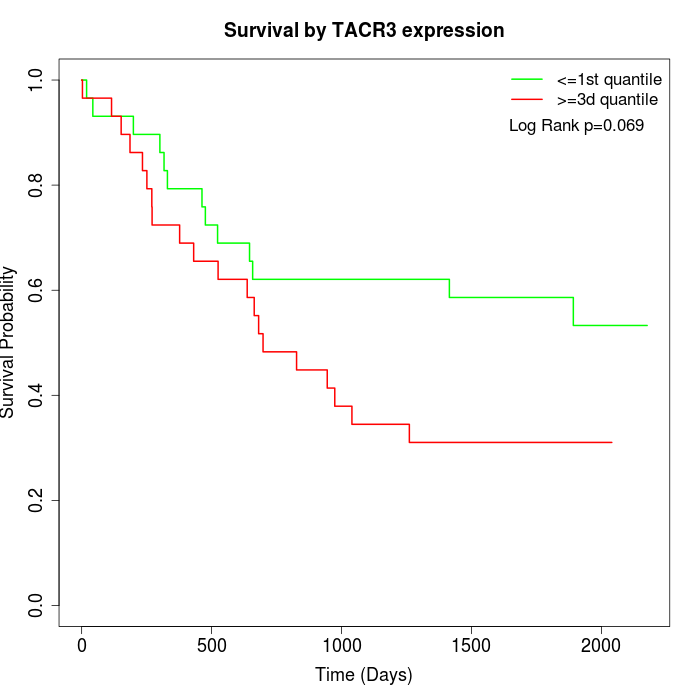 | 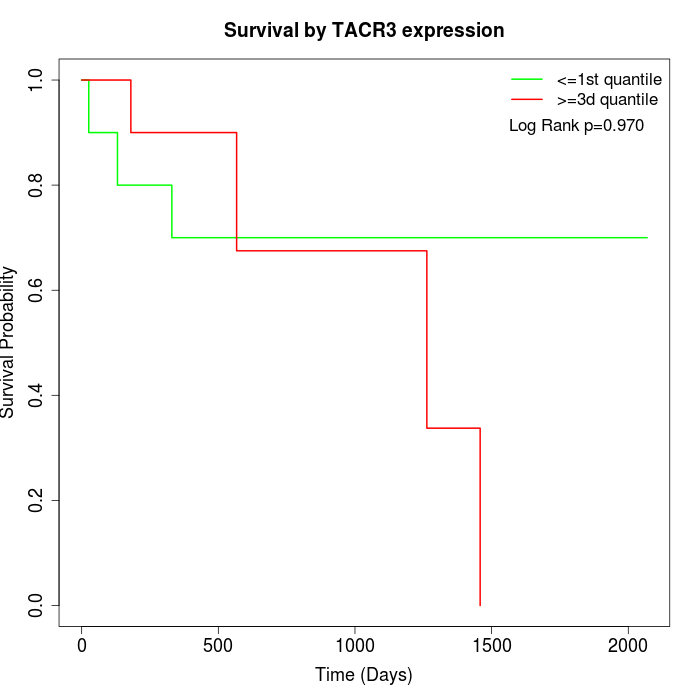 |
| GSE53622 | GSE53624 | TCGA |
Note: Click image to view full size file.
Copy number change of TACR3:
| Dataset | Gene | EntrezID | Gain | Loss | Normal | Detail |
|---|---|---|---|---|---|---|
| GSE15526 | TACR3 | 6870 | 0 | 12 | 18 | |
| GSE20123 | TACR3 | 6870 | 0 | 12 | 18 | |
| GSE43470 | TACR3 | 6870 | 0 | 13 | 30 | |
| GSE46452 | TACR3 | 6870 | 1 | 36 | 22 | |
| GSE47630 | TACR3 | 6870 | 0 | 20 | 20 | |
| GSE54993 | TACR3 | 6870 | 9 | 0 | 61 | |
| GSE54994 | TACR3 | 6870 | 1 | 10 | 42 | |
| GSE60625 | TACR3 | 6870 | 0 | 3 | 8 | |
| GSE74703 | TACR3 | 6870 | 0 | 11 | 25 | |
| GSE74704 | TACR3 | 6870 | 0 | 6 | 14 | |
| TCGA | TACR3 | 6870 | 7 | 38 | 51 |
Total number of gains: 18; Total number of losses: 161; Total Number of normals: 309.
Somatic mutations of TACR3:
Generating mutation plots.
Highly correlated genes for TACR3:
Showing top 20/619 corelated genes with mean PCC>0.5.
| Gene1 | Gene2 | Mean PCC | Num. Datasets | Num. PCC<0 | Num. PCC>0.5 |
|---|---|---|---|---|---|
| TACR3 | CHRM2 | 0.719685 | 5 | 0 | 5 |
| TACR3 | SLC17A4 | 0.708015 | 5 | 0 | 5 |
| TACR3 | GP1BA | 0.68816 | 4 | 0 | 4 |
| TACR3 | DAB1 | 0.682675 | 5 | 0 | 5 |
| TACR3 | EPOR | 0.68093 | 4 | 0 | 4 |
| TACR3 | RNF185-AS1 | 0.679781 | 5 | 0 | 5 |
| TACR3 | CYP2D6 | 0.678435 | 4 | 0 | 4 |
| TACR3 | NCR1 | 0.674665 | 5 | 0 | 5 |
| TACR3 | NTNG1 | 0.673536 | 4 | 0 | 4 |
| TACR3 | CA7 | 0.670067 | 4 | 0 | 3 |
| TACR3 | RUNX2 | 0.669705 | 4 | 0 | 4 |
| TACR3 | CYP3A4 | 0.668209 | 4 | 0 | 3 |
| TACR3 | CCR3 | 0.667908 | 4 | 0 | 4 |
| TACR3 | SLC10A1 | 0.664994 | 4 | 0 | 4 |
| TACR3 | CYP19A1 | 0.655438 | 4 | 0 | 4 |
| TACR3 | RPGRIP1 | 0.654461 | 4 | 0 | 4 |
| TACR3 | LINC00574 | 0.653743 | 5 | 0 | 5 |
| TACR3 | FSCN3 | 0.651255 | 4 | 0 | 4 |
| TACR3 | KHDRBS2 | 0.651012 | 4 | 0 | 4 |
| TACR3 | HECW1 | 0.650778 | 4 | 0 | 4 |
For details and further investigation, click here